@TingAstro
Yuan-Sen Ting
The Ohio State University
Transcending the Limits of Astrostatistics
with Deep Learning
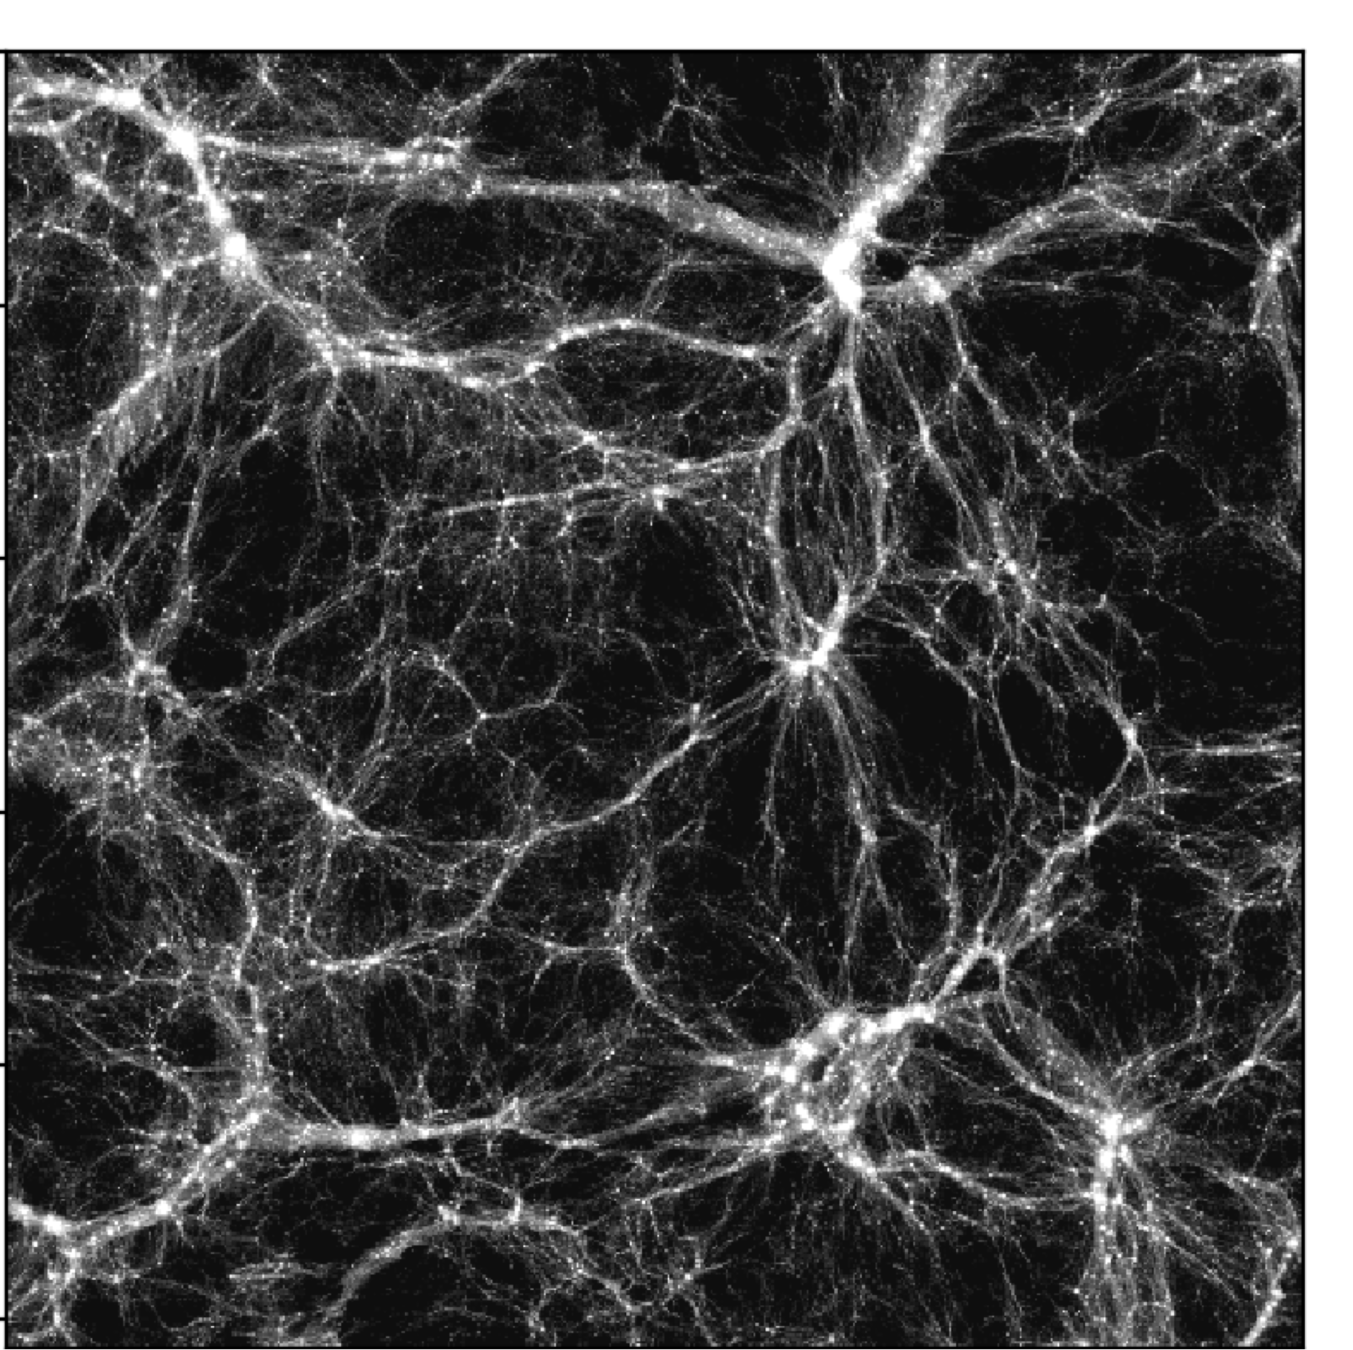
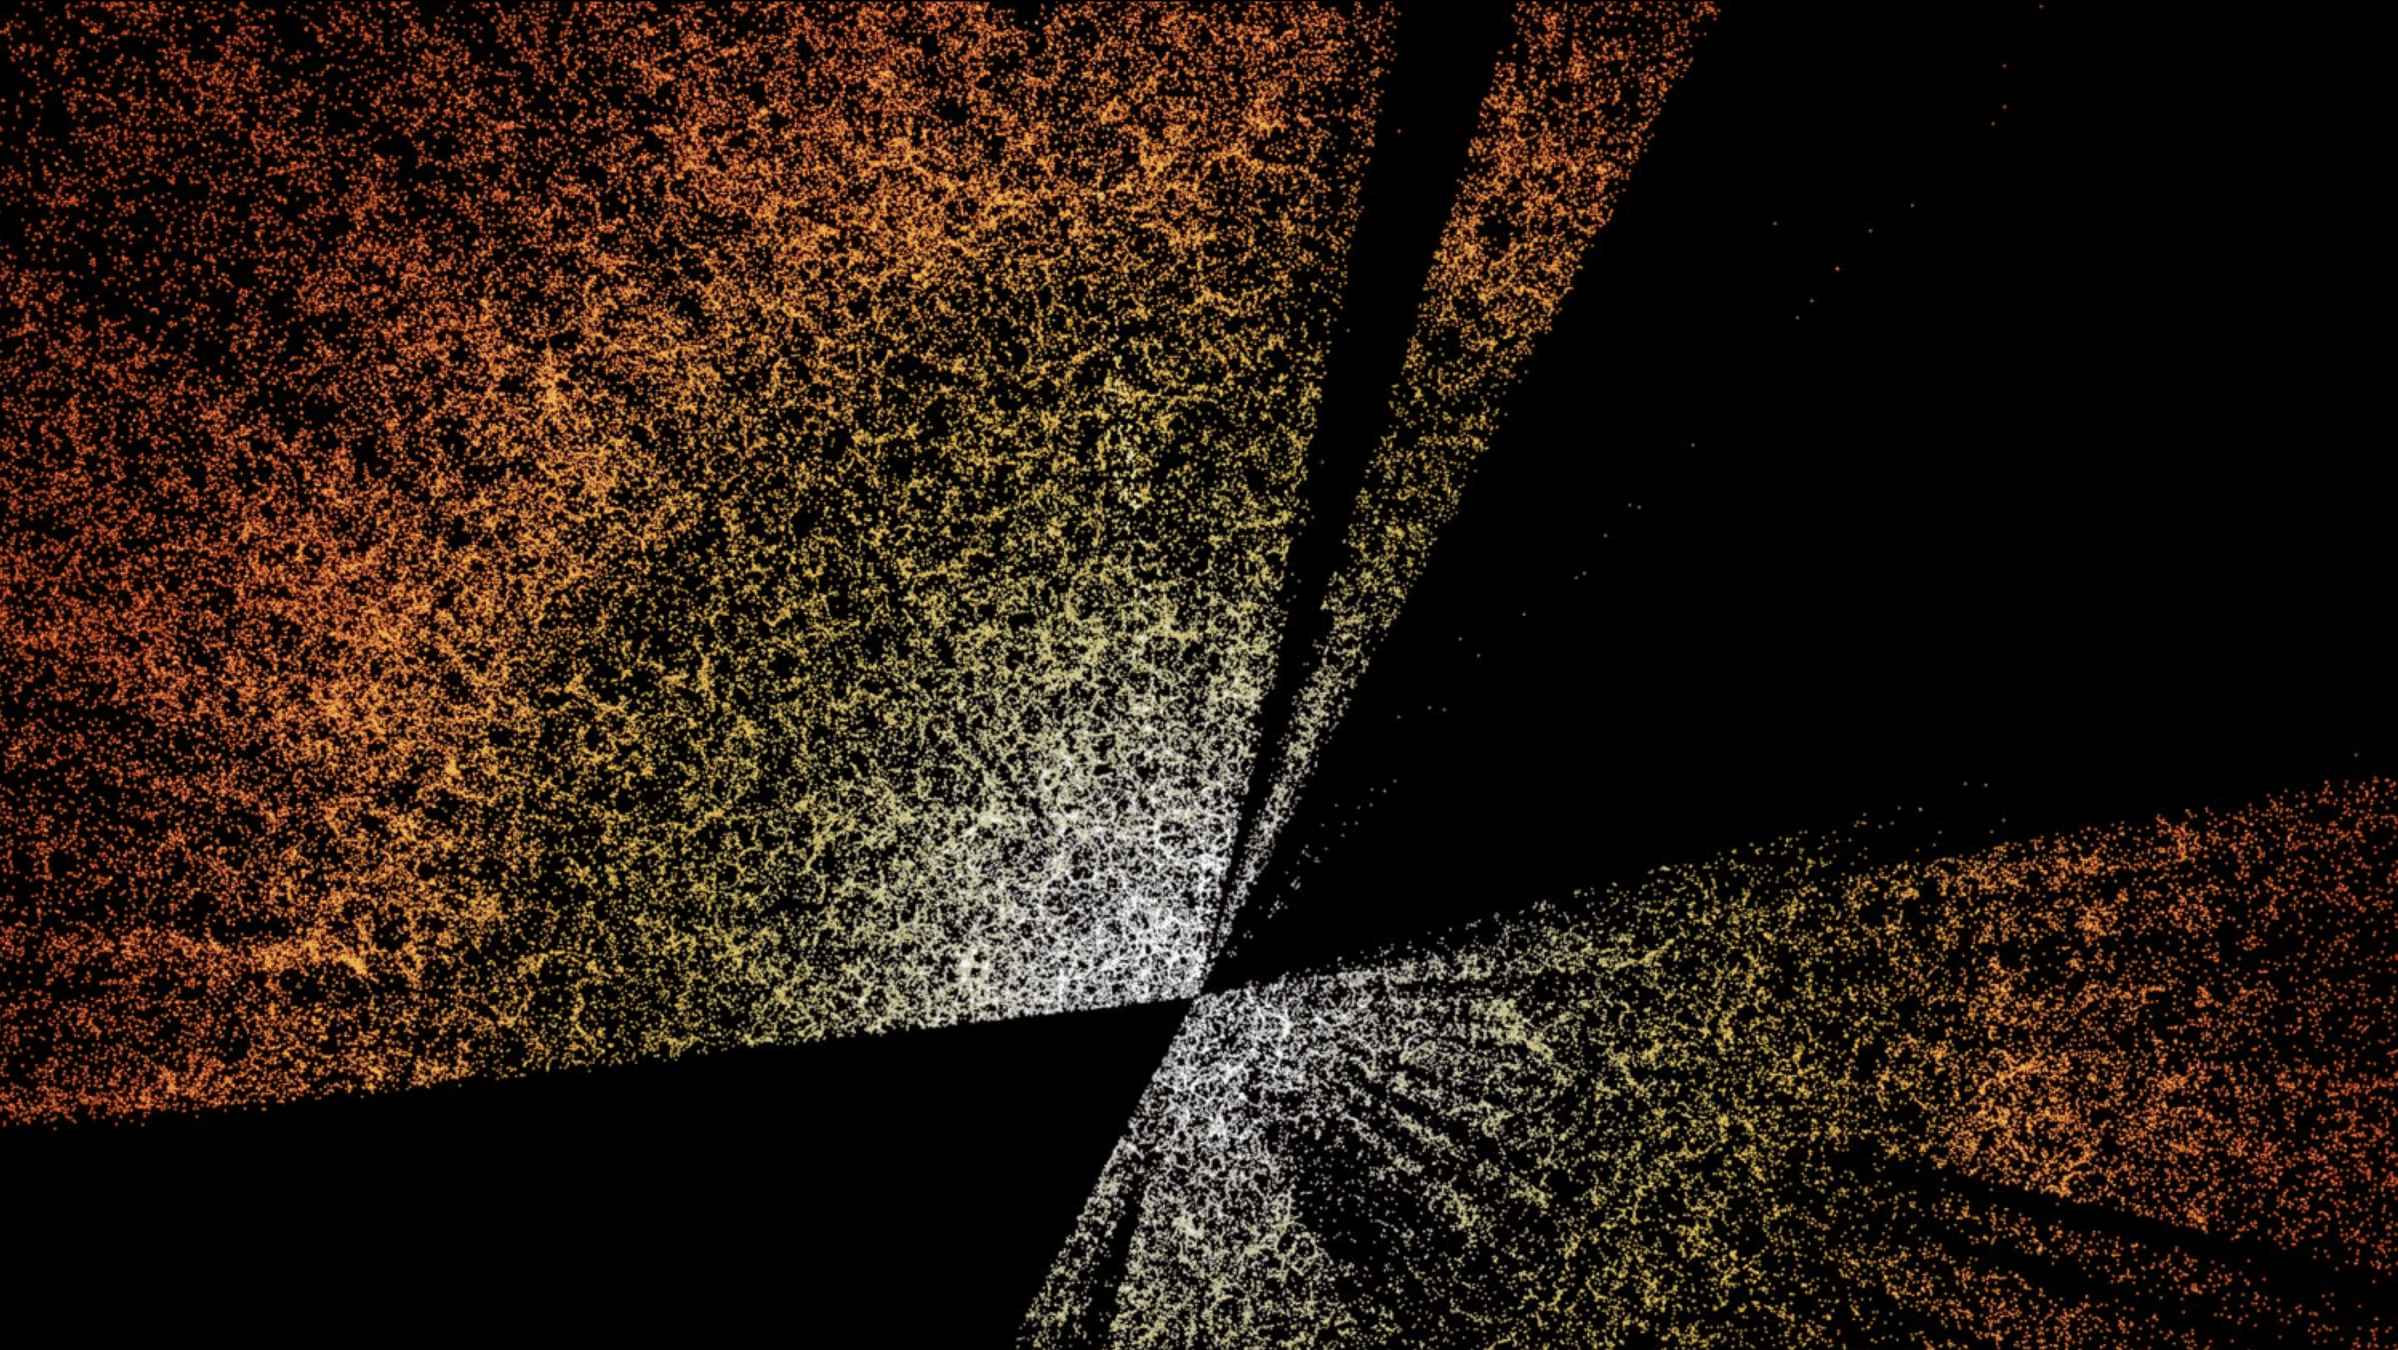
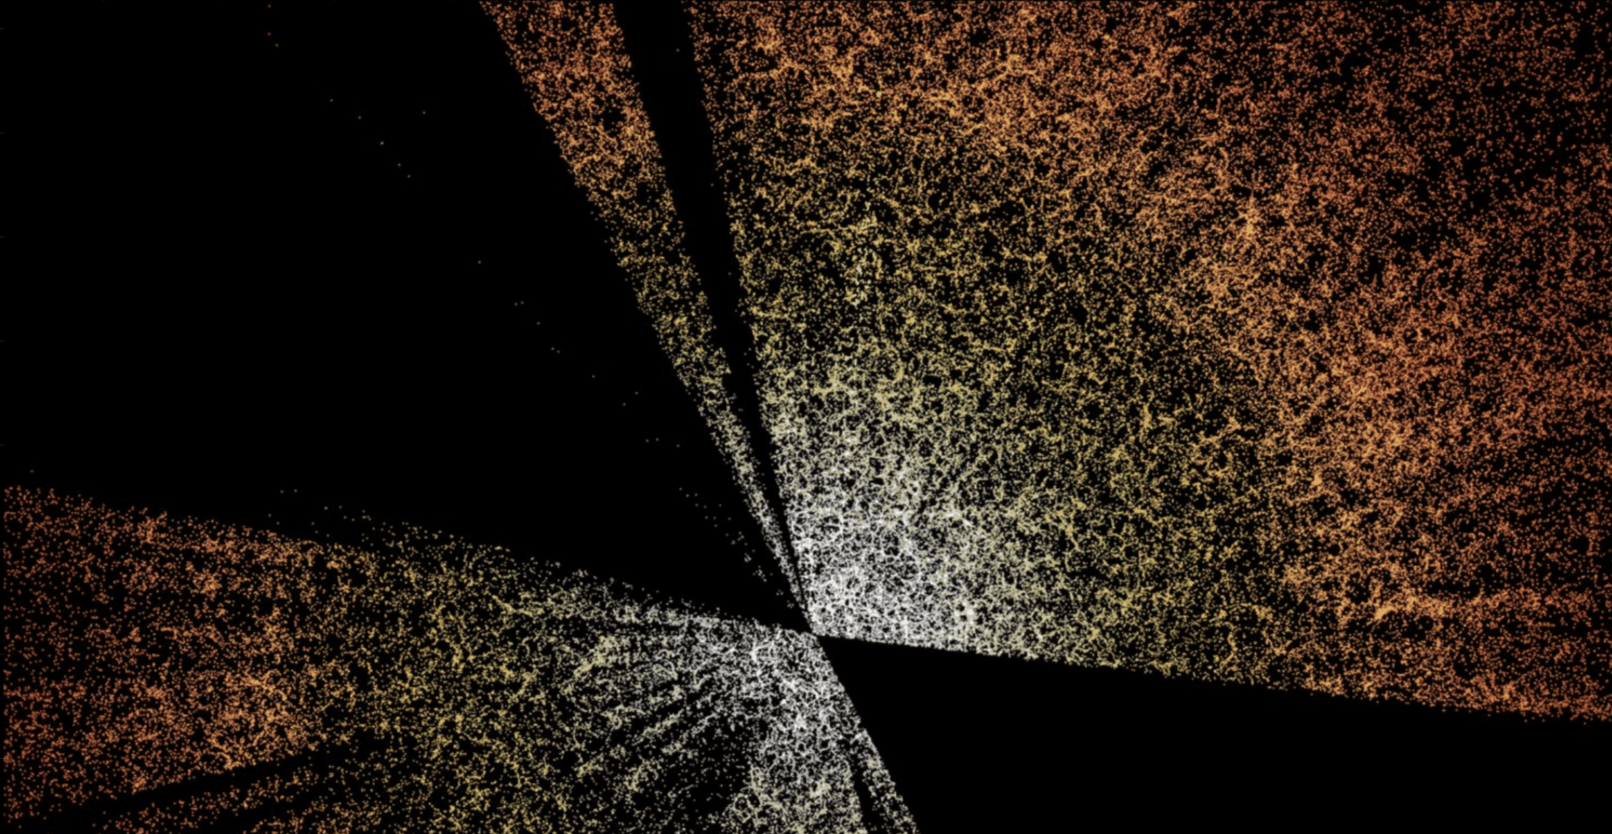
Large-scale structure
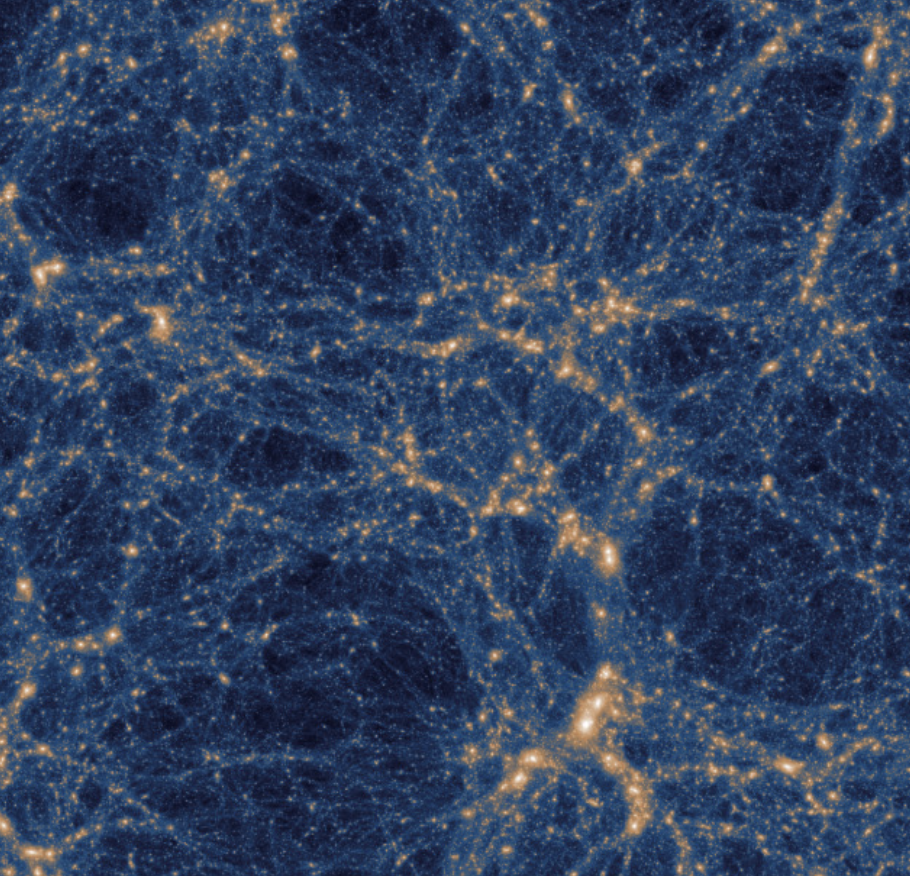
Cosmology
Euclid, DESI, PFS, ROMAN, CSST
Most phenomenology in physics is a complex stochastic field
Credit: Illustris
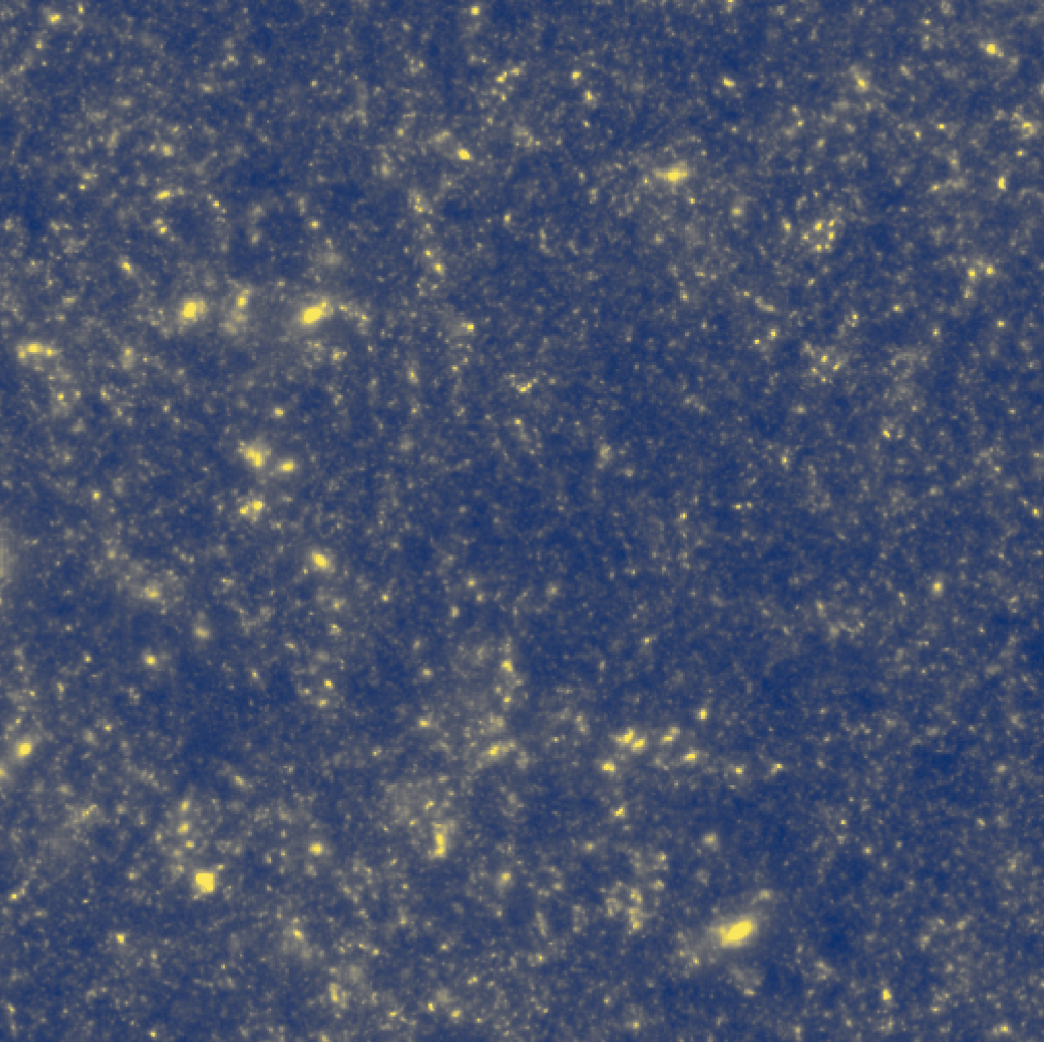
Large-scale structure
Cosmology
Credit: Illustris
Most phenomenology in physics is a complex stochastic field
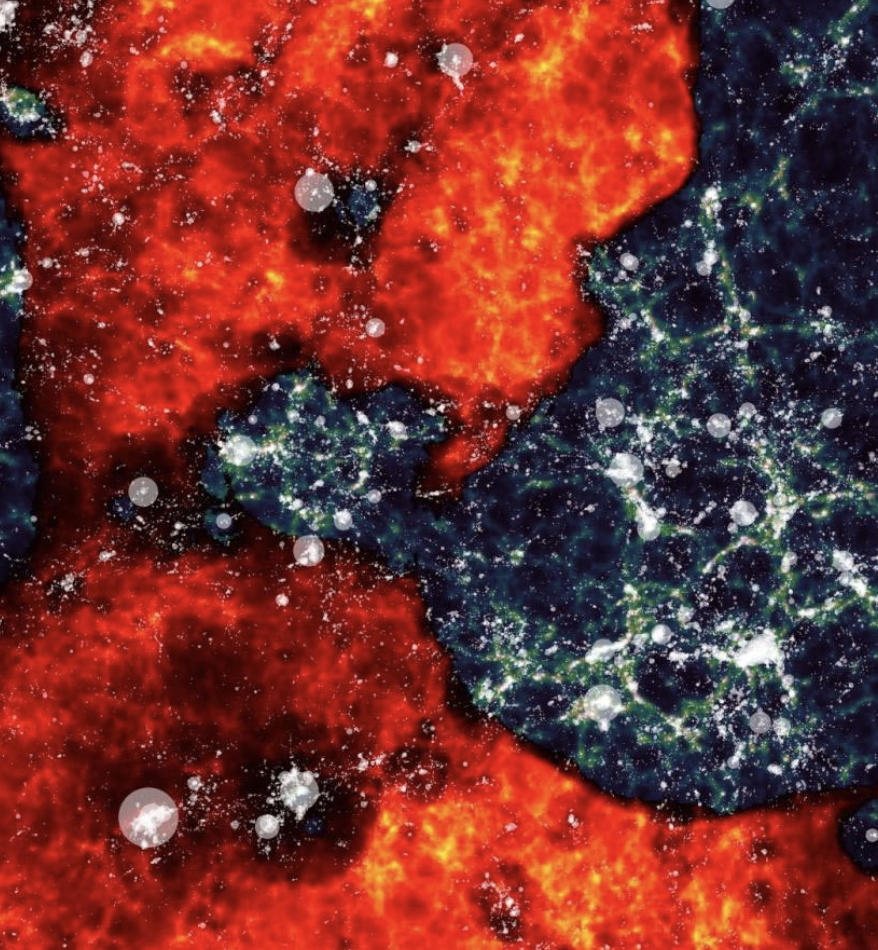
Cosmic Reionisation
SKA, HERA, MWA
Most phenomenology in physics is a complex stochastic field
Cosmology
Credit: ESO
GAIA Satellite
Galactic physics
Motions of a billion stars
SDSS-V, 4MOST, MUST
Most phenomenology in physics is a complex stochastic field
Credit: ESA
Posterior
Prior
Likelihood
P ( physics | observation ) p ( observation | physics ) * p ( physics )
Oh well, statistics
P ( price | car ) p ( car | price ) * p ( price )
Prior
P ( price | car ) = p ( car | price ) * p ( price )
Likelihood
P ( price | car ) = p ( car | price ) * p ( price )
Posterior
P ( physics | observation ) p ( observation | physics ) * p ( physics )
Very high dimensional
Bayesian statistics has been limited to a few domains in astro.
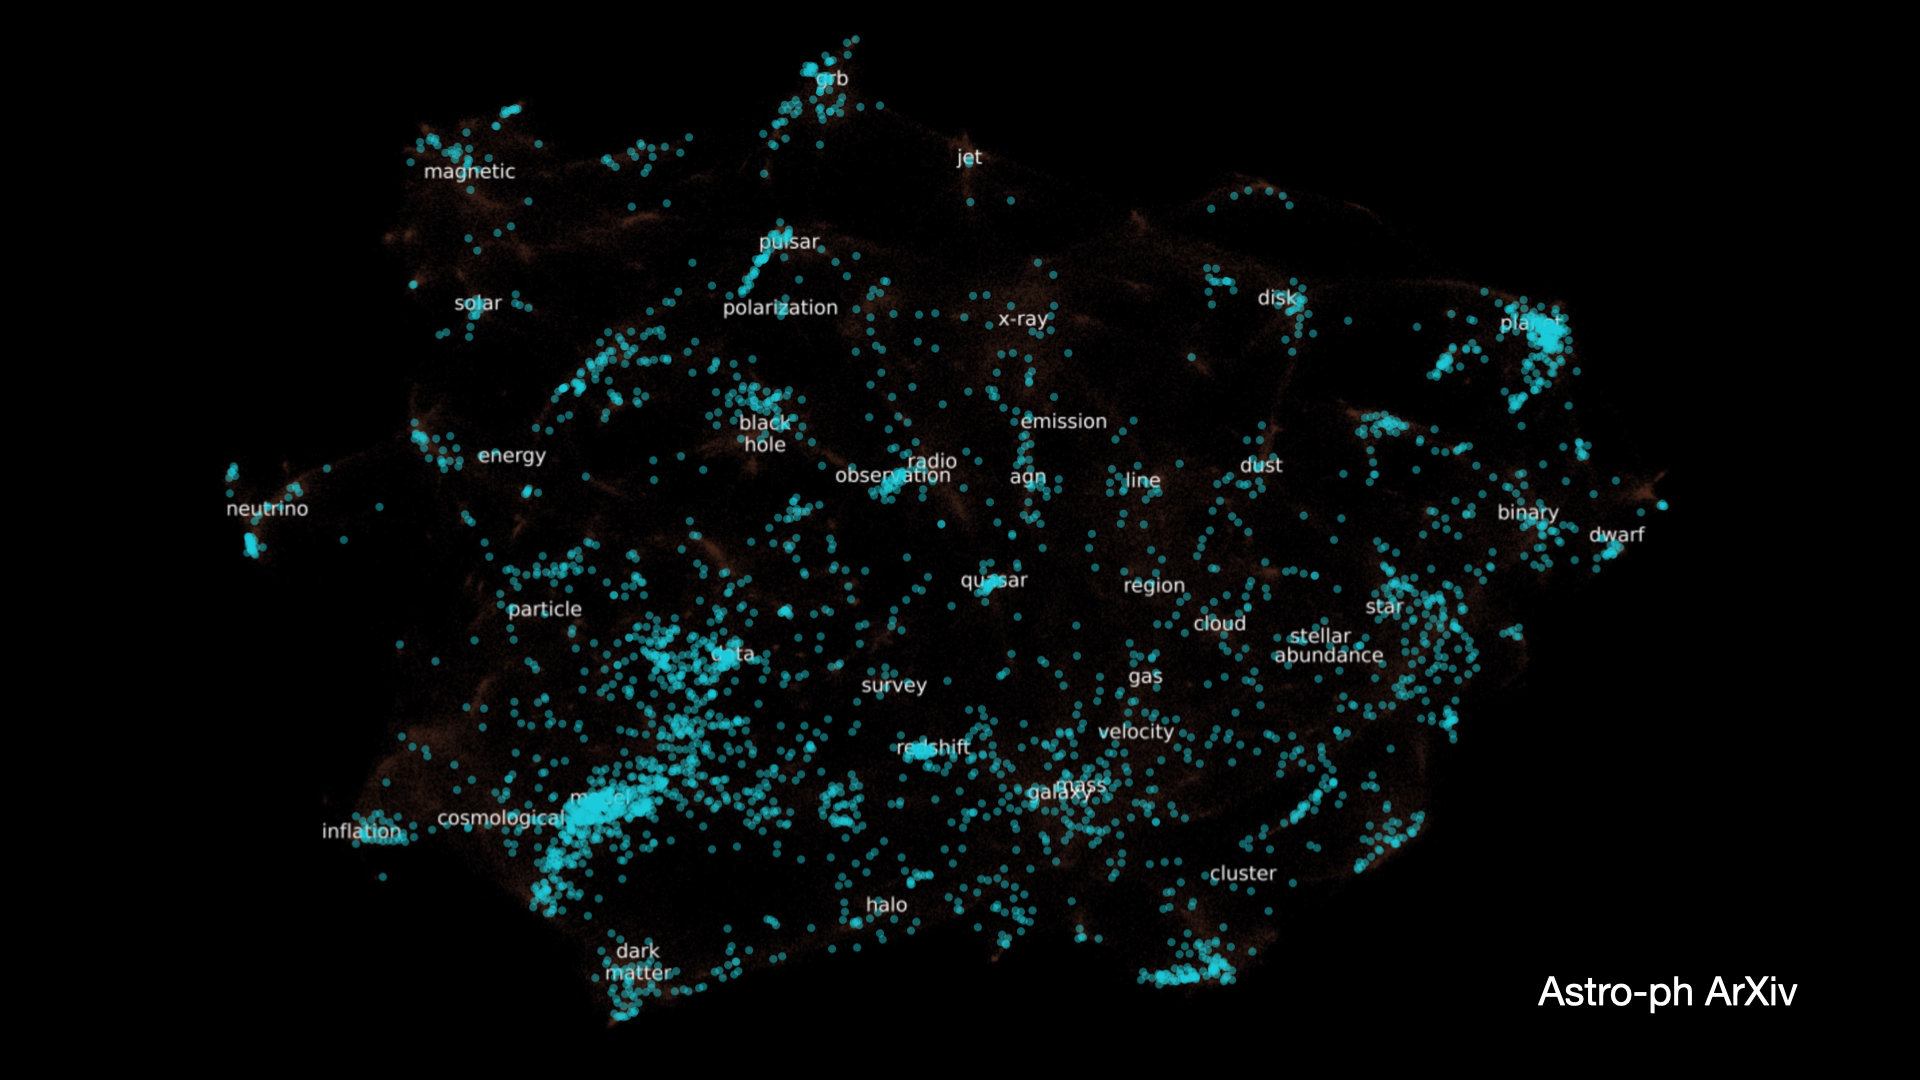
Credit : arxivsorter.org
Astro-ph arXiv
Credit : arxivsorter.org
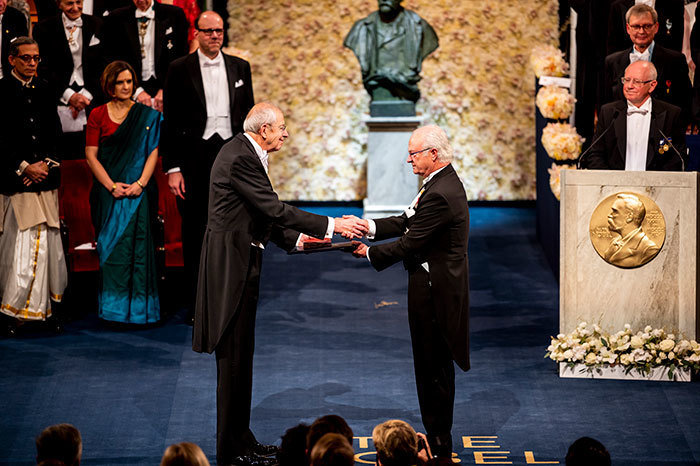
Nobel Prize 11, 19
Exoplanet
Pulsar
Nobel Prize 74, 93
Nobel Prize 19
Bayesian statistics has been limited to a few domains in astro.
Astro-ph arXiv
Cosmology
Credit : arxivsorter.org
Exoplanet
Plasma
Turbulence
Nobel Prize 11, 19
Nobel Prize 19
Pulsar
Nobel Prize 74, 93
Cosmology
Star Formation,
Galaxy Evolution,
Black Hole Physics
Astrostatistics
Gaussian / "Linear"
Deep Learning
Non-Gaussian /
"Non-Linear"
(e.g. early cosmology)
(e.g. reionisation, turbulence, galaxy evolution, star formation)
Mathematics of information - better summary statistics
Generative AI - Simulation-Based Inferences
How to quantify a high-dimensional likelihood
"One of the principal objects of research in my department of knowledge is to find the point of view from which the subject appears in the greatest simplicity"
- Gibbs
Complexity
Stochasticity

My niece
E.g.,
orientation
projecting out uninformative variability
"Physical Modelling"
Sersic profile
(or "structures")
("uninformative" variances)
Complexity
Stochasticity
Cosmic Microwave Background
Reionization
Intergalactic Medium Tomography
Large-Scale Structure
(or "structures")
("uninformative" variances)
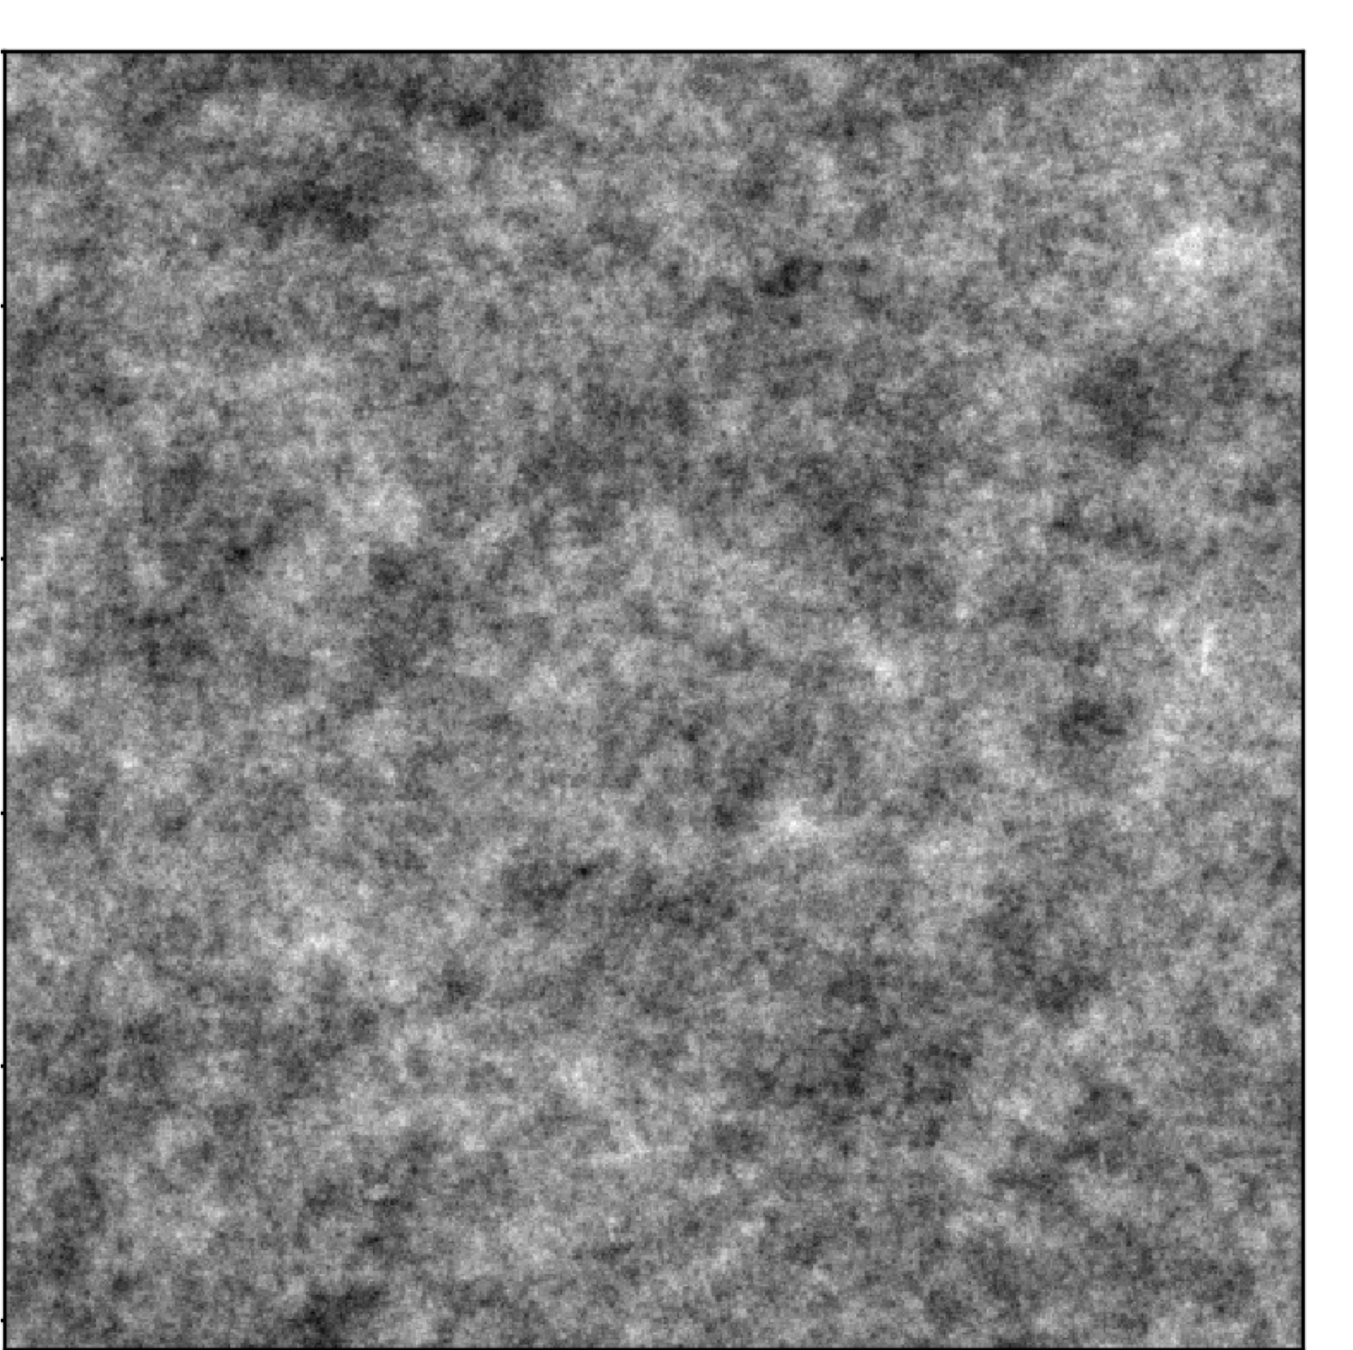
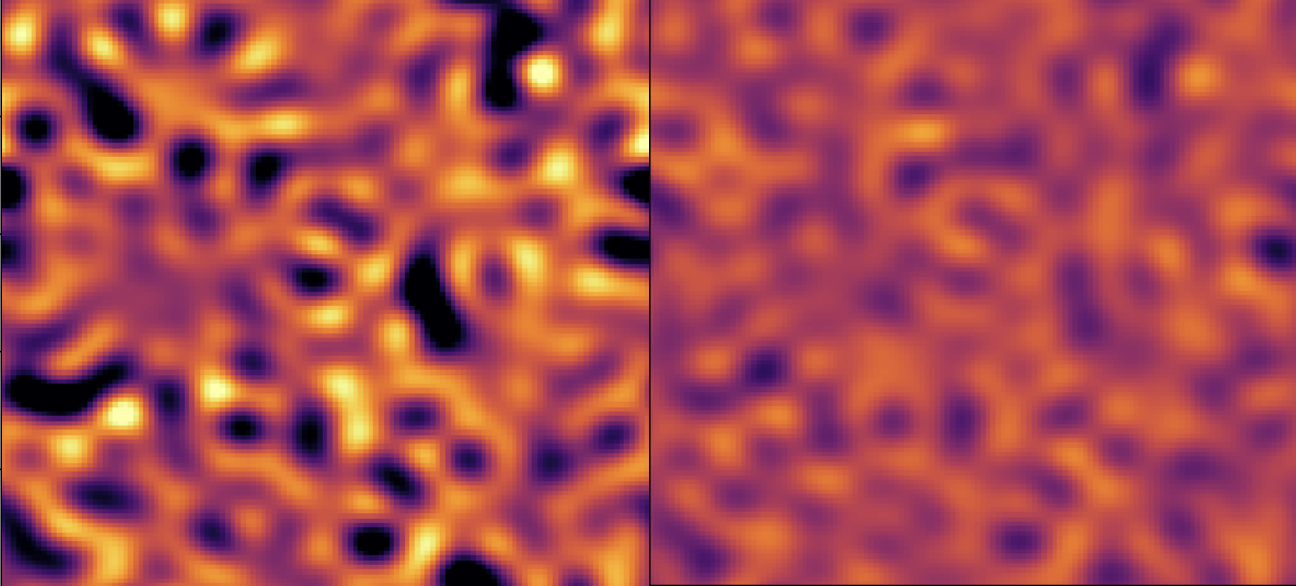
Characterising stochastic fields is challenging
Gaussian
Non-Gaussian
Simple
Complex
Power spectrum
Power spectrum
Complexity
Stochasticity
(or "structures")
("uninformative" variances)
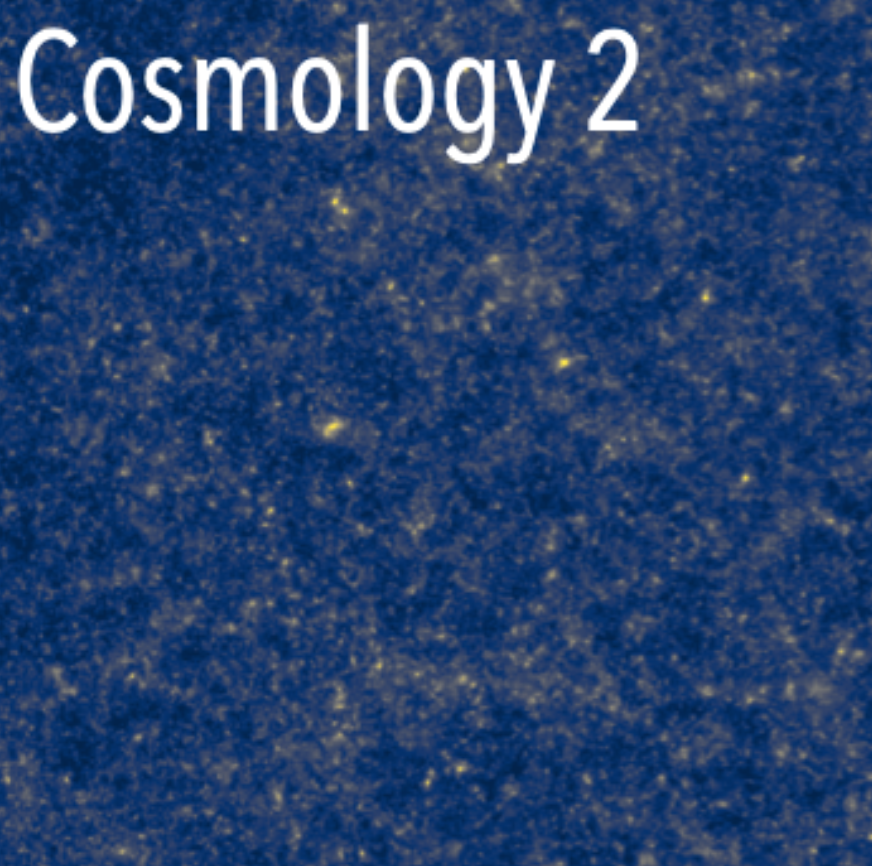
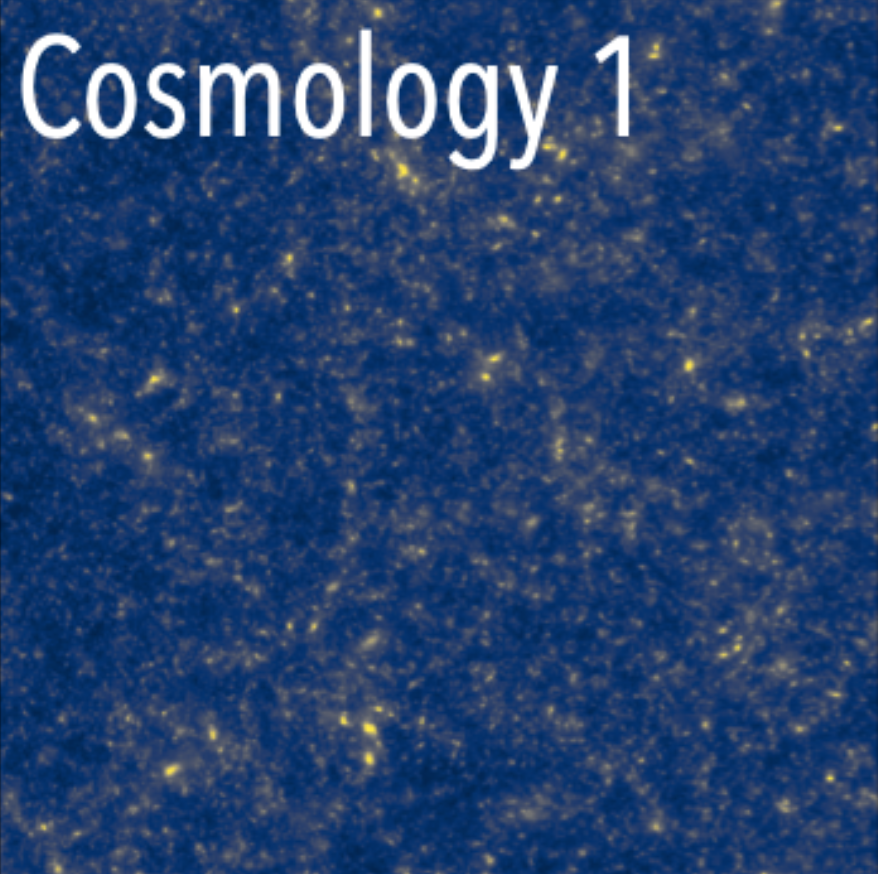
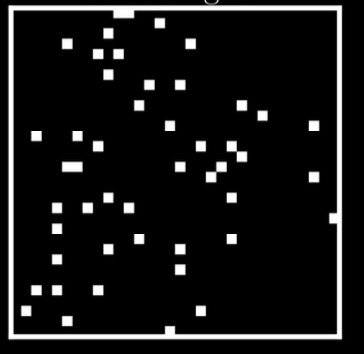
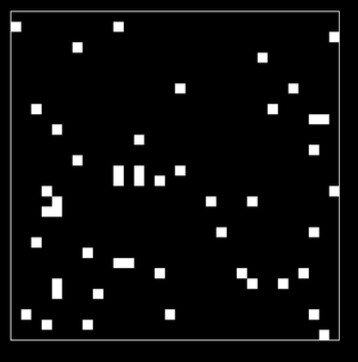
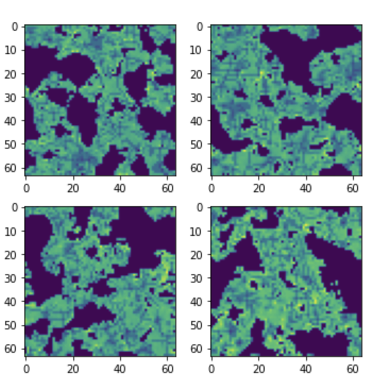
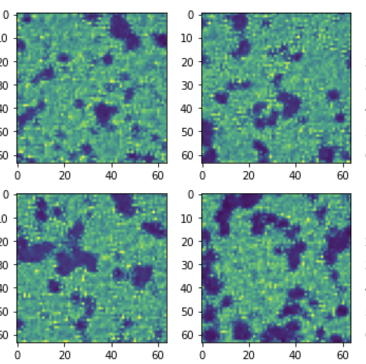
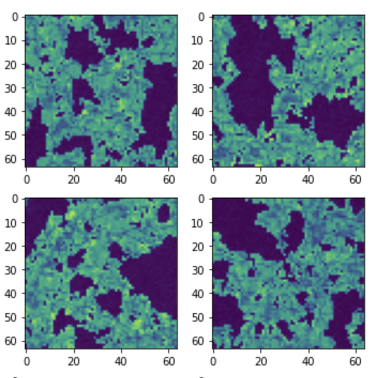
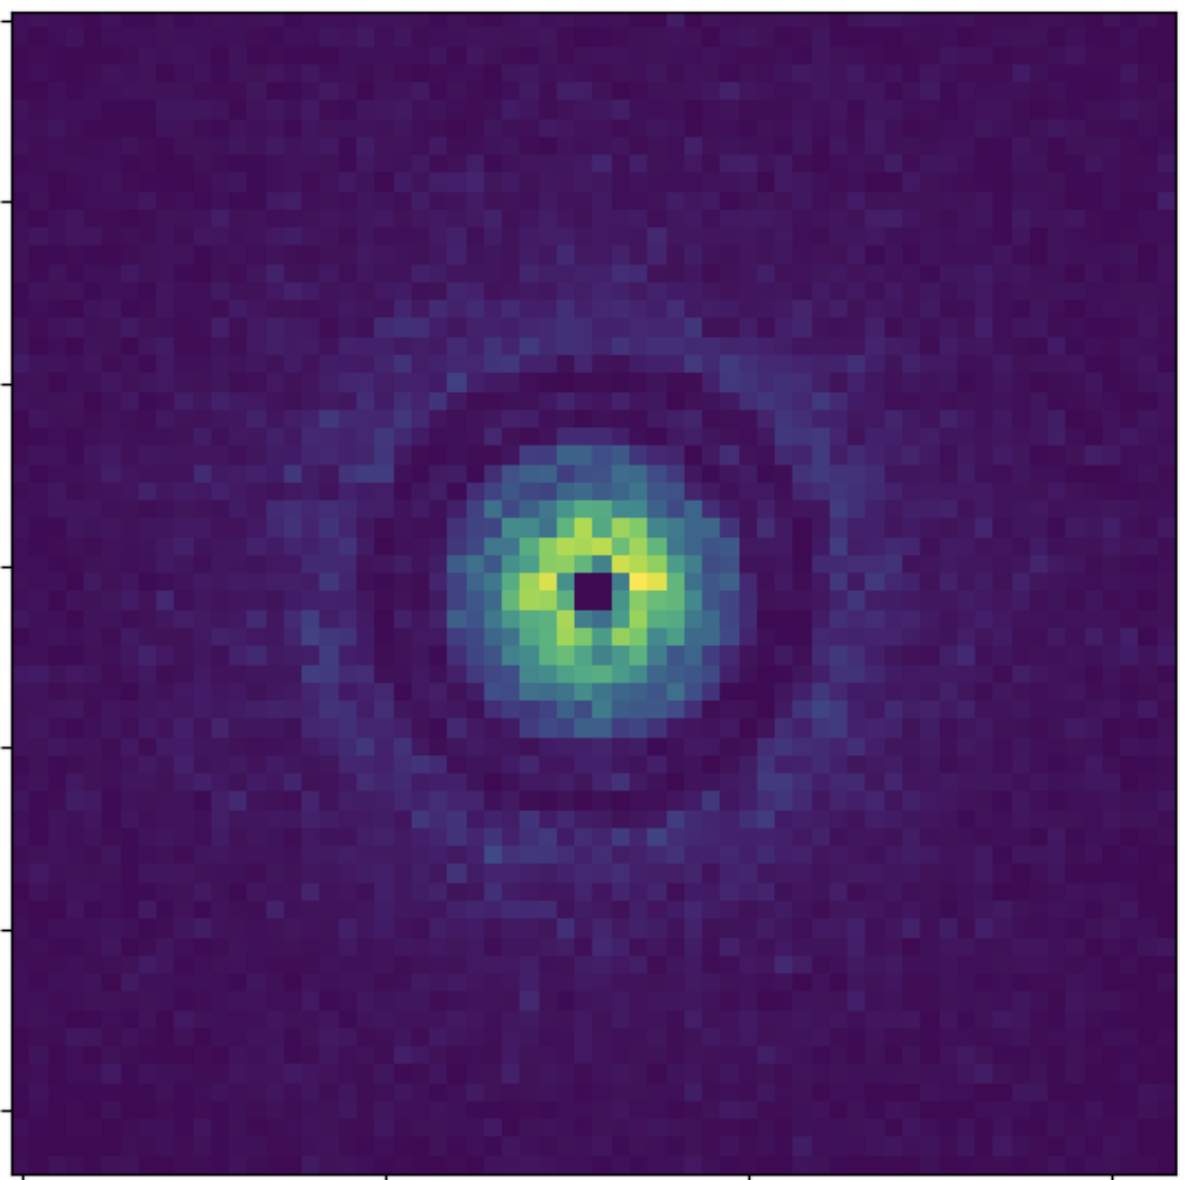
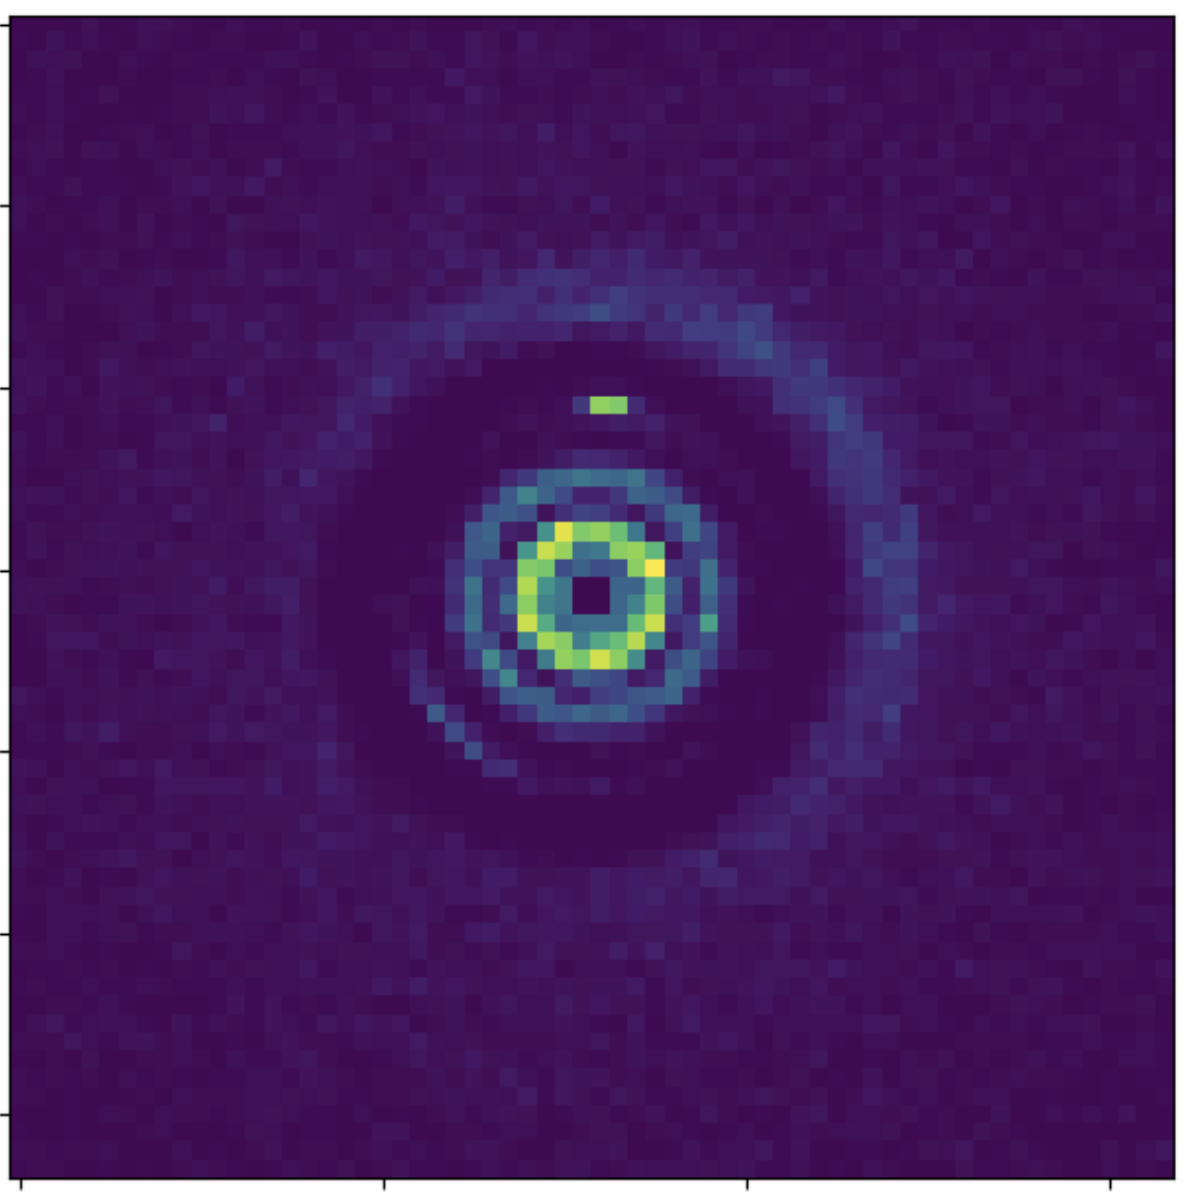
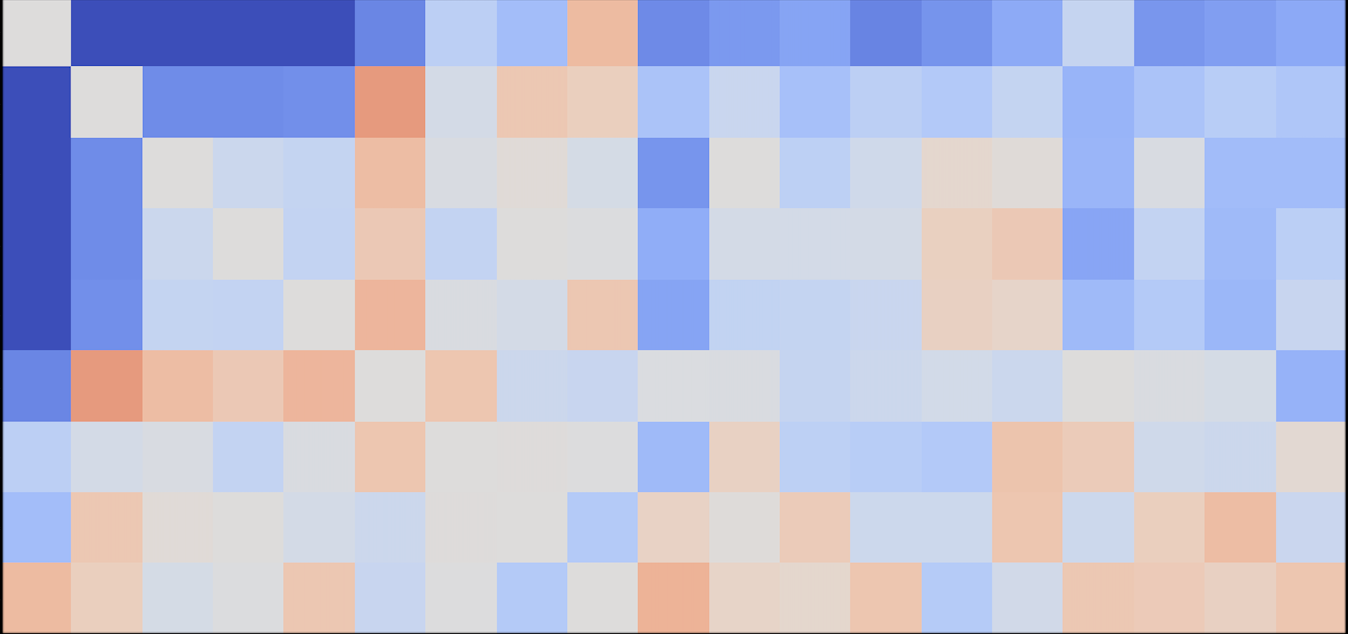
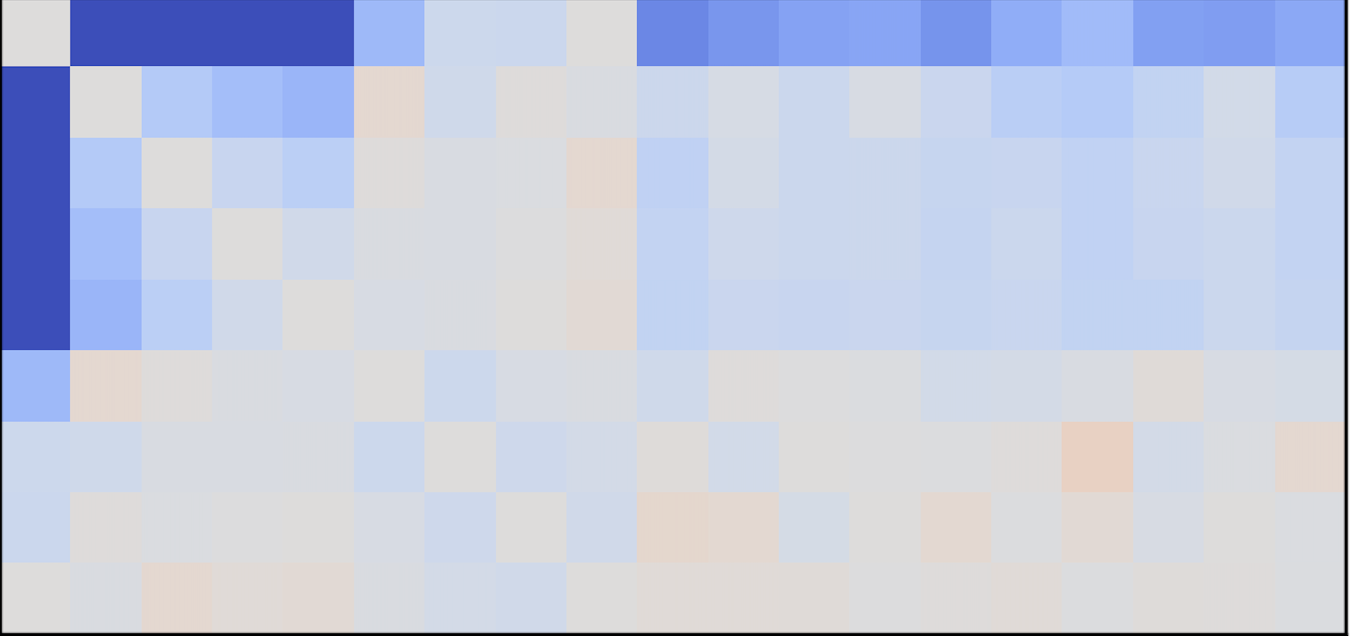
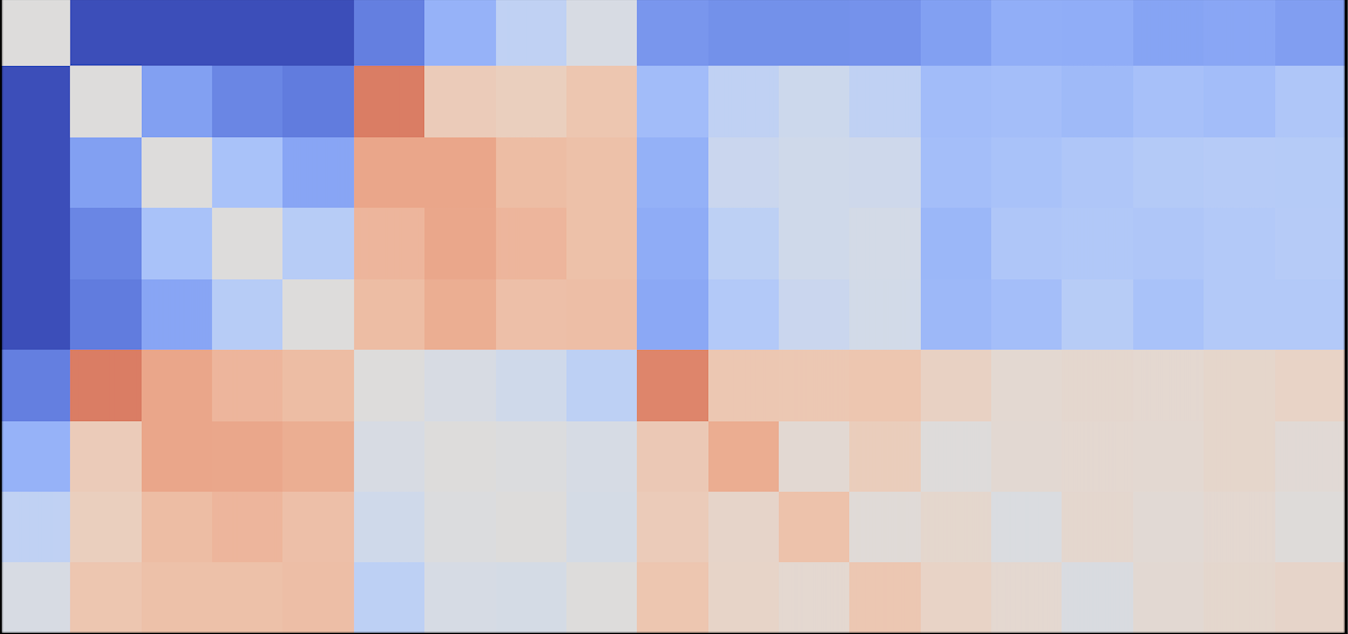
These two images have the same power spectrum
Gaining mathematical insights from deep learning
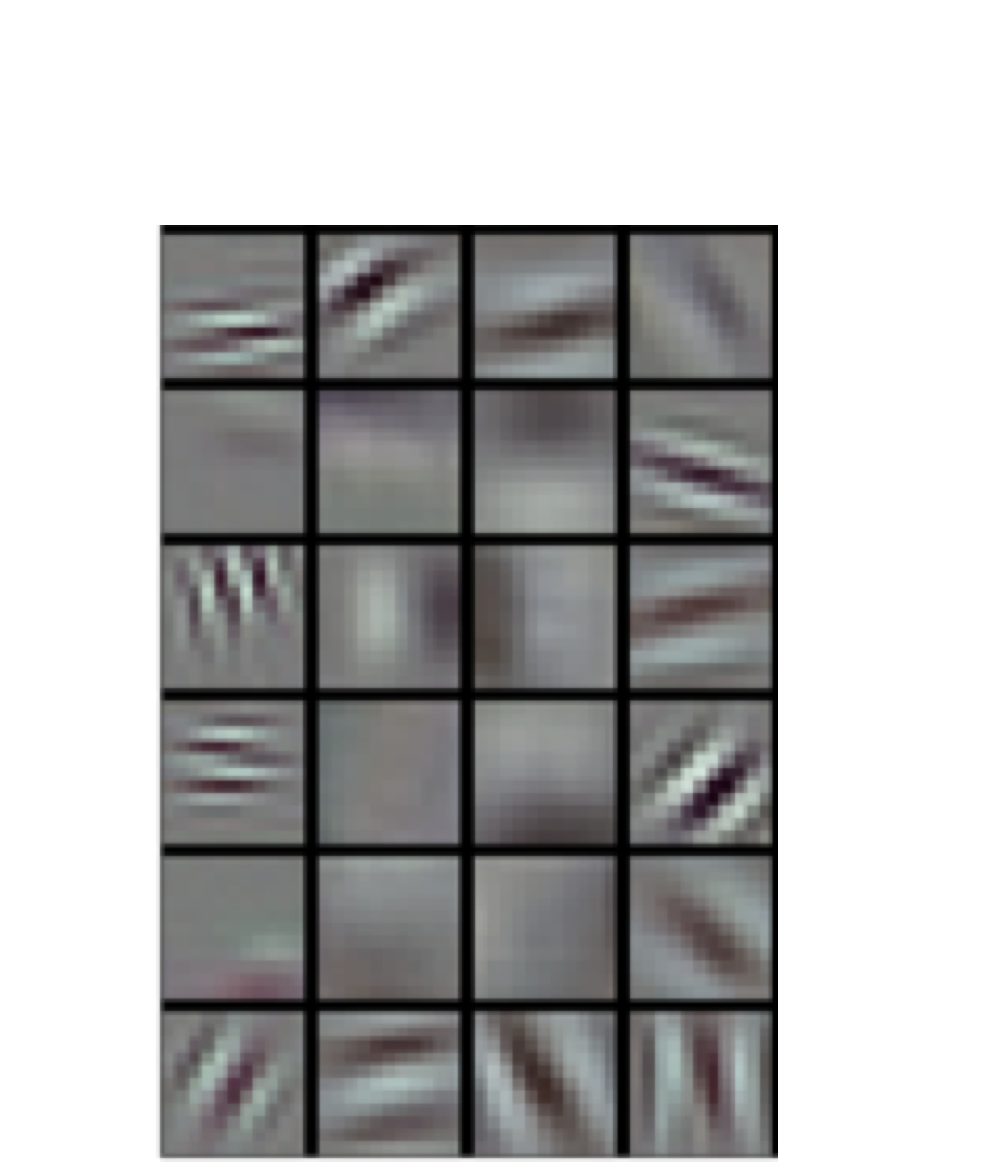
(1) Convolution
(2) Non-linearity
(or "activation function")
e.g., ReLU
(4) Iterate
e.g., tanh, sigmoid
(3) Averaging
Why convolutional neural networks work ?
Alchemy ???
Not really ...
These two images have the same power spectrum
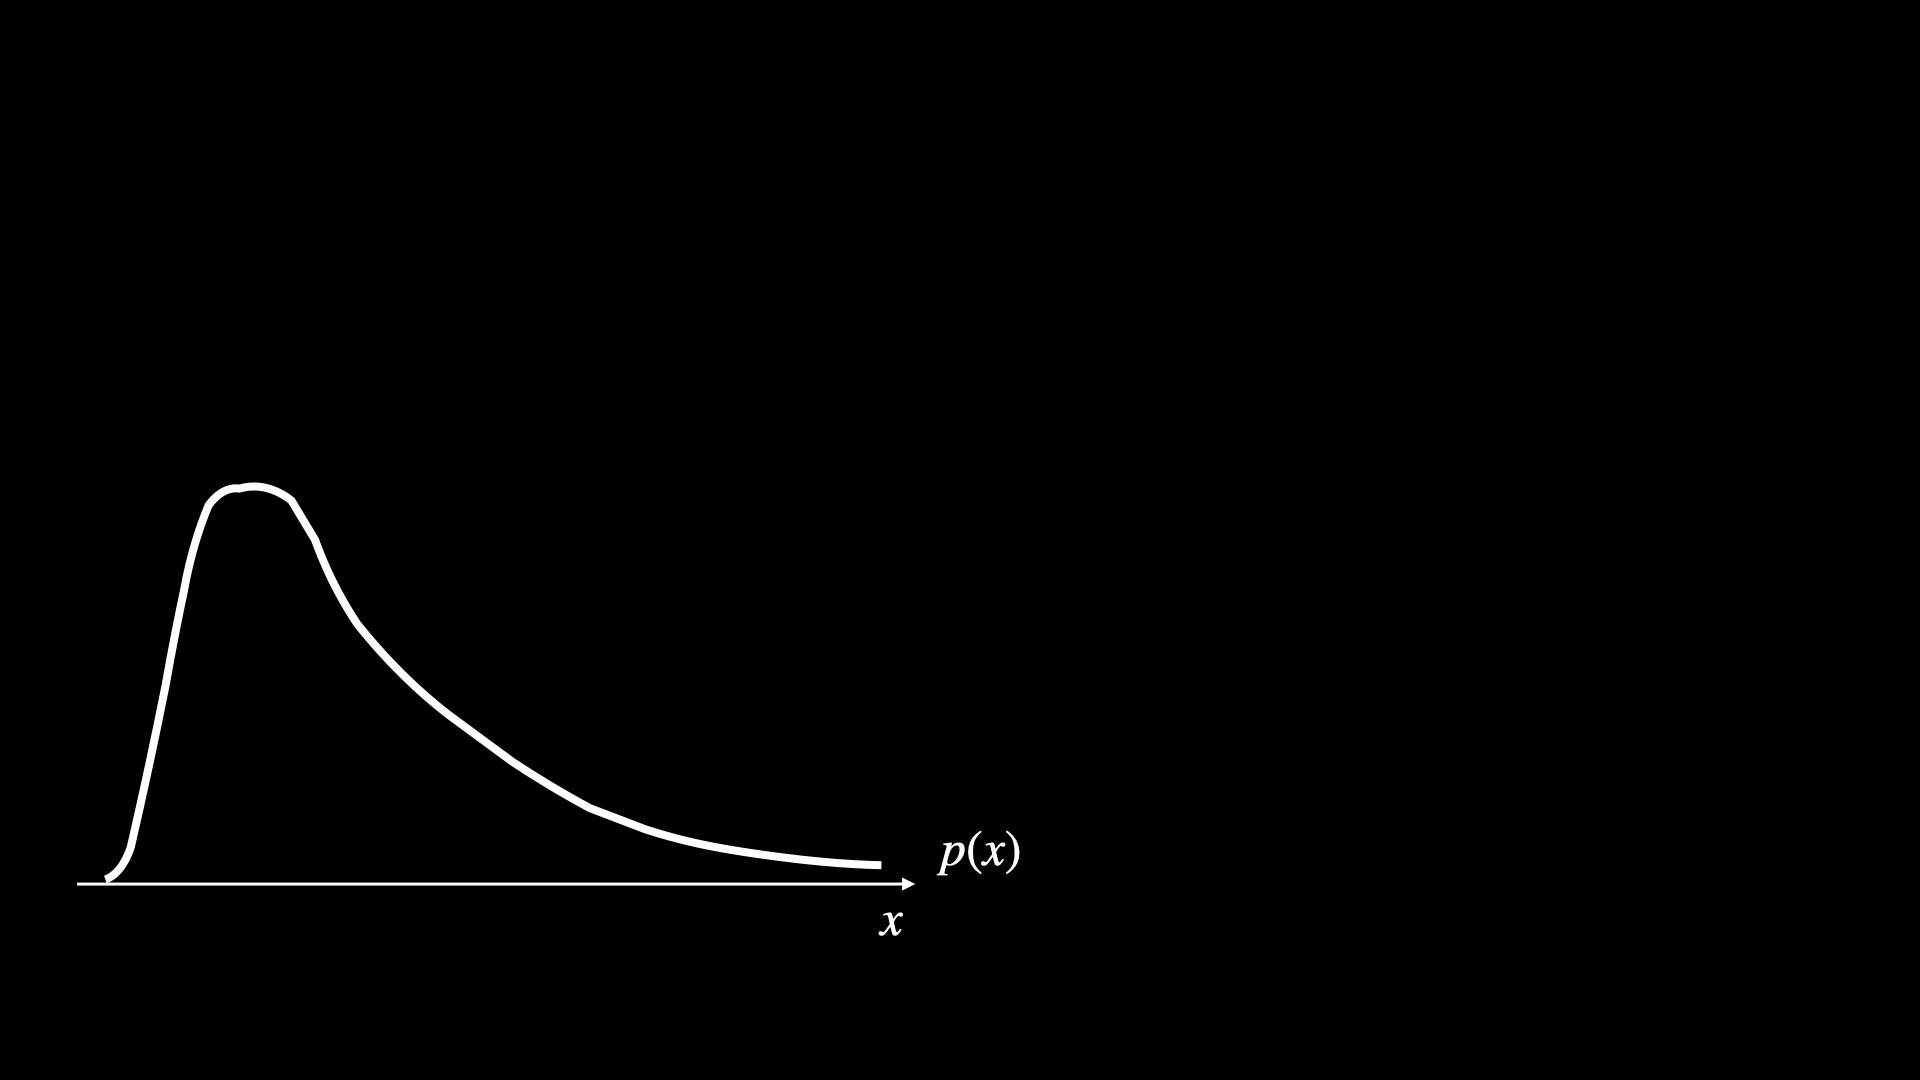
Consider a single random variable
From why power spectrum fails to how CNNs work : a 1D case
Consider a single random variable
From why power spectrum fails to how CNNs work : a 1D case
Consider a single random variable
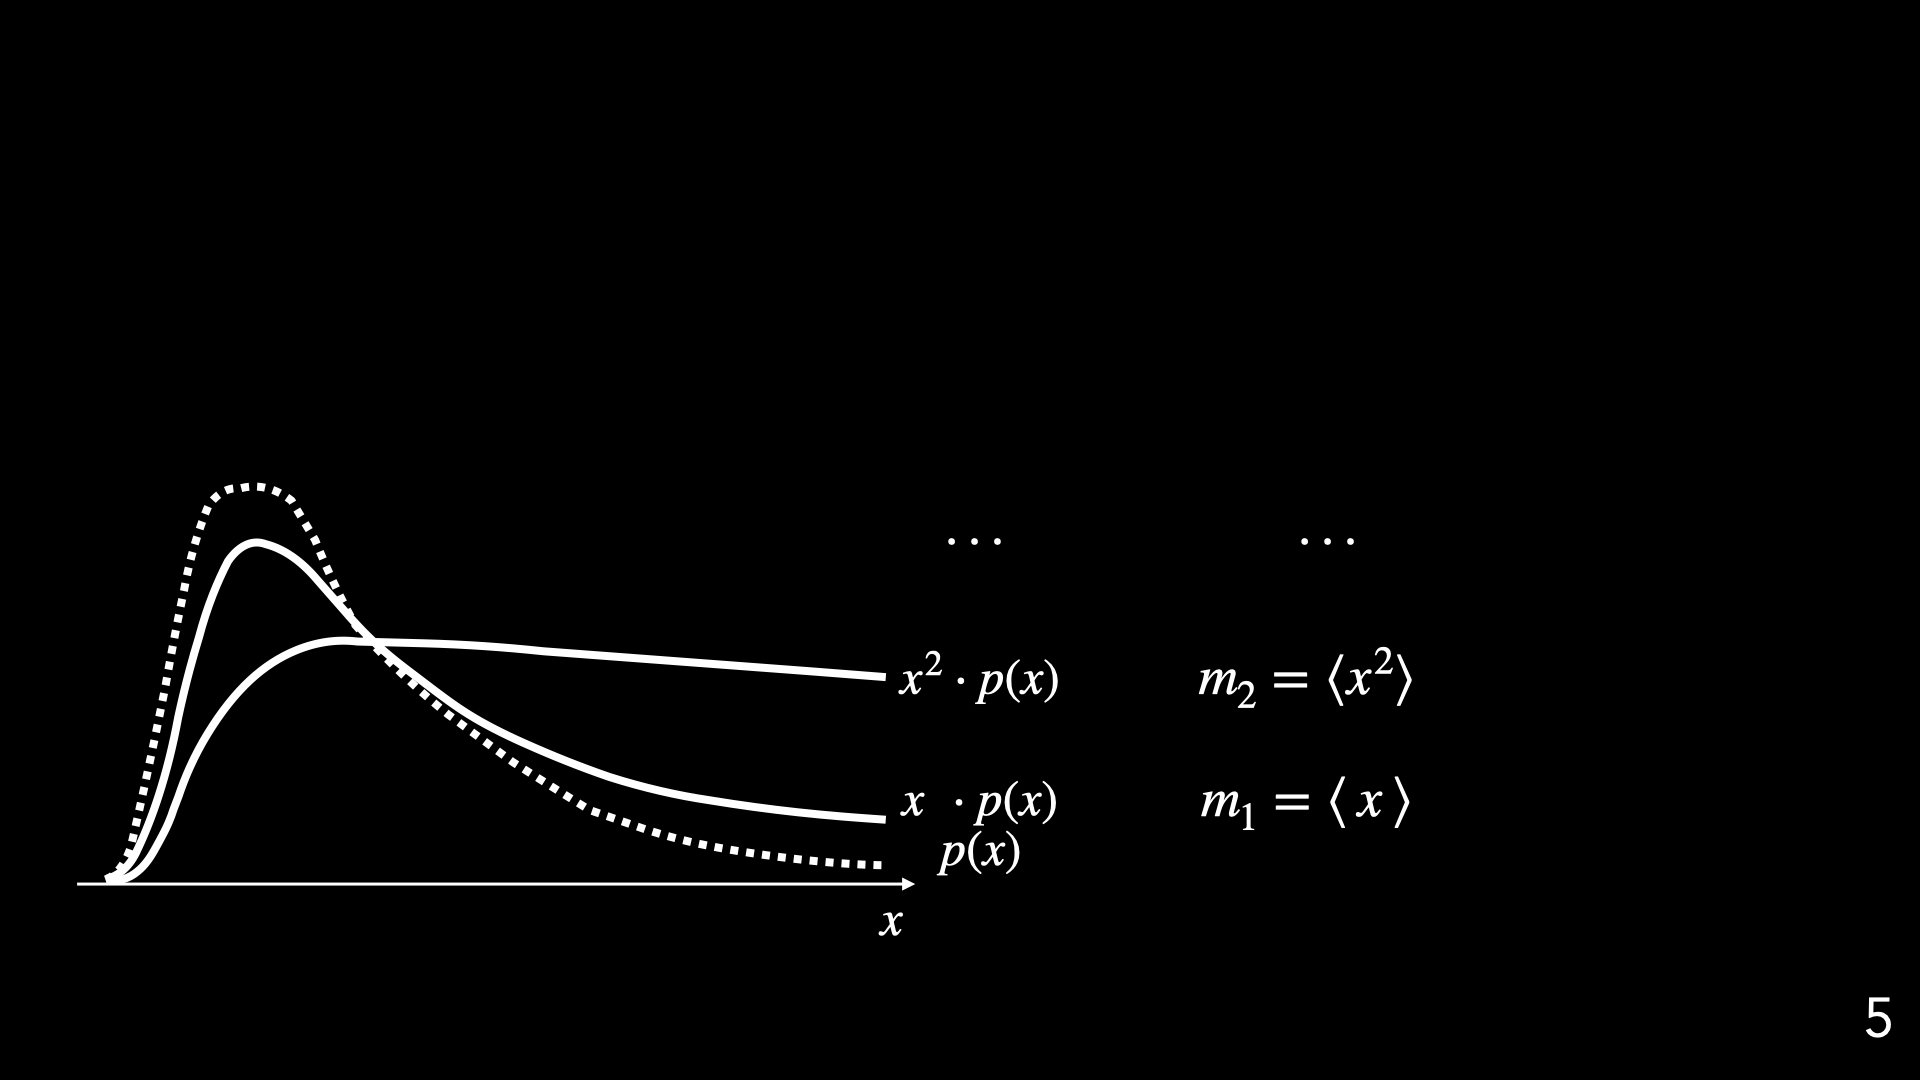
In 1D, power spectrum is equivalent to taking the second moment
Variance
Skewness
The "tail" differentiates these two patterns
From why power spectrum fails to how CNNs work : a 1D case
Quantifying distribution functions with higher-order moments?
Consider a single random variable
Variance
Skewness
Skewness defines locality
Classical lores : characterizing
with all its moments
Heavy tail
(Non-Gaussian)
Naively taking higher-order moments is not a good idea
Naively taking higher-order moments is not a good idea
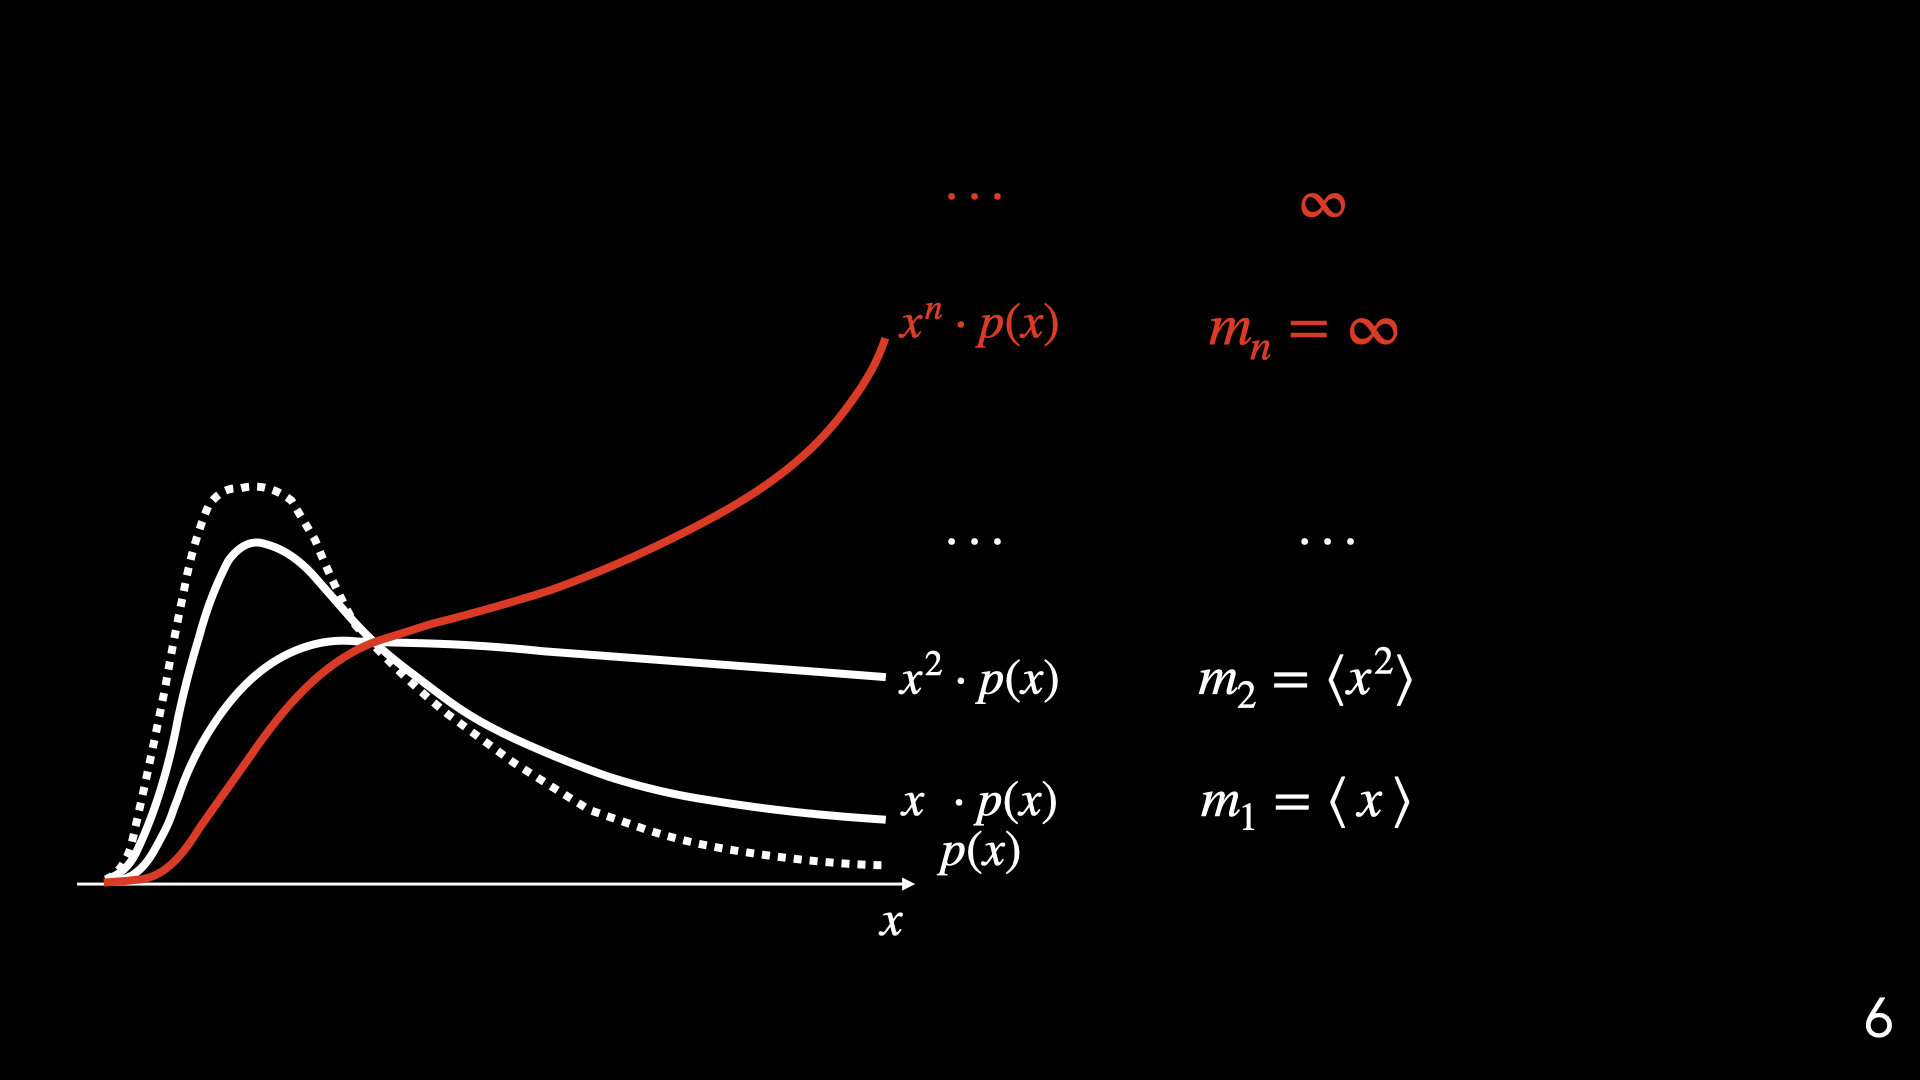
Depend critically on the "outliers"; subjected to the sampling noise
The estimates are noisy
Naively taking higher-order moments is not a good idea
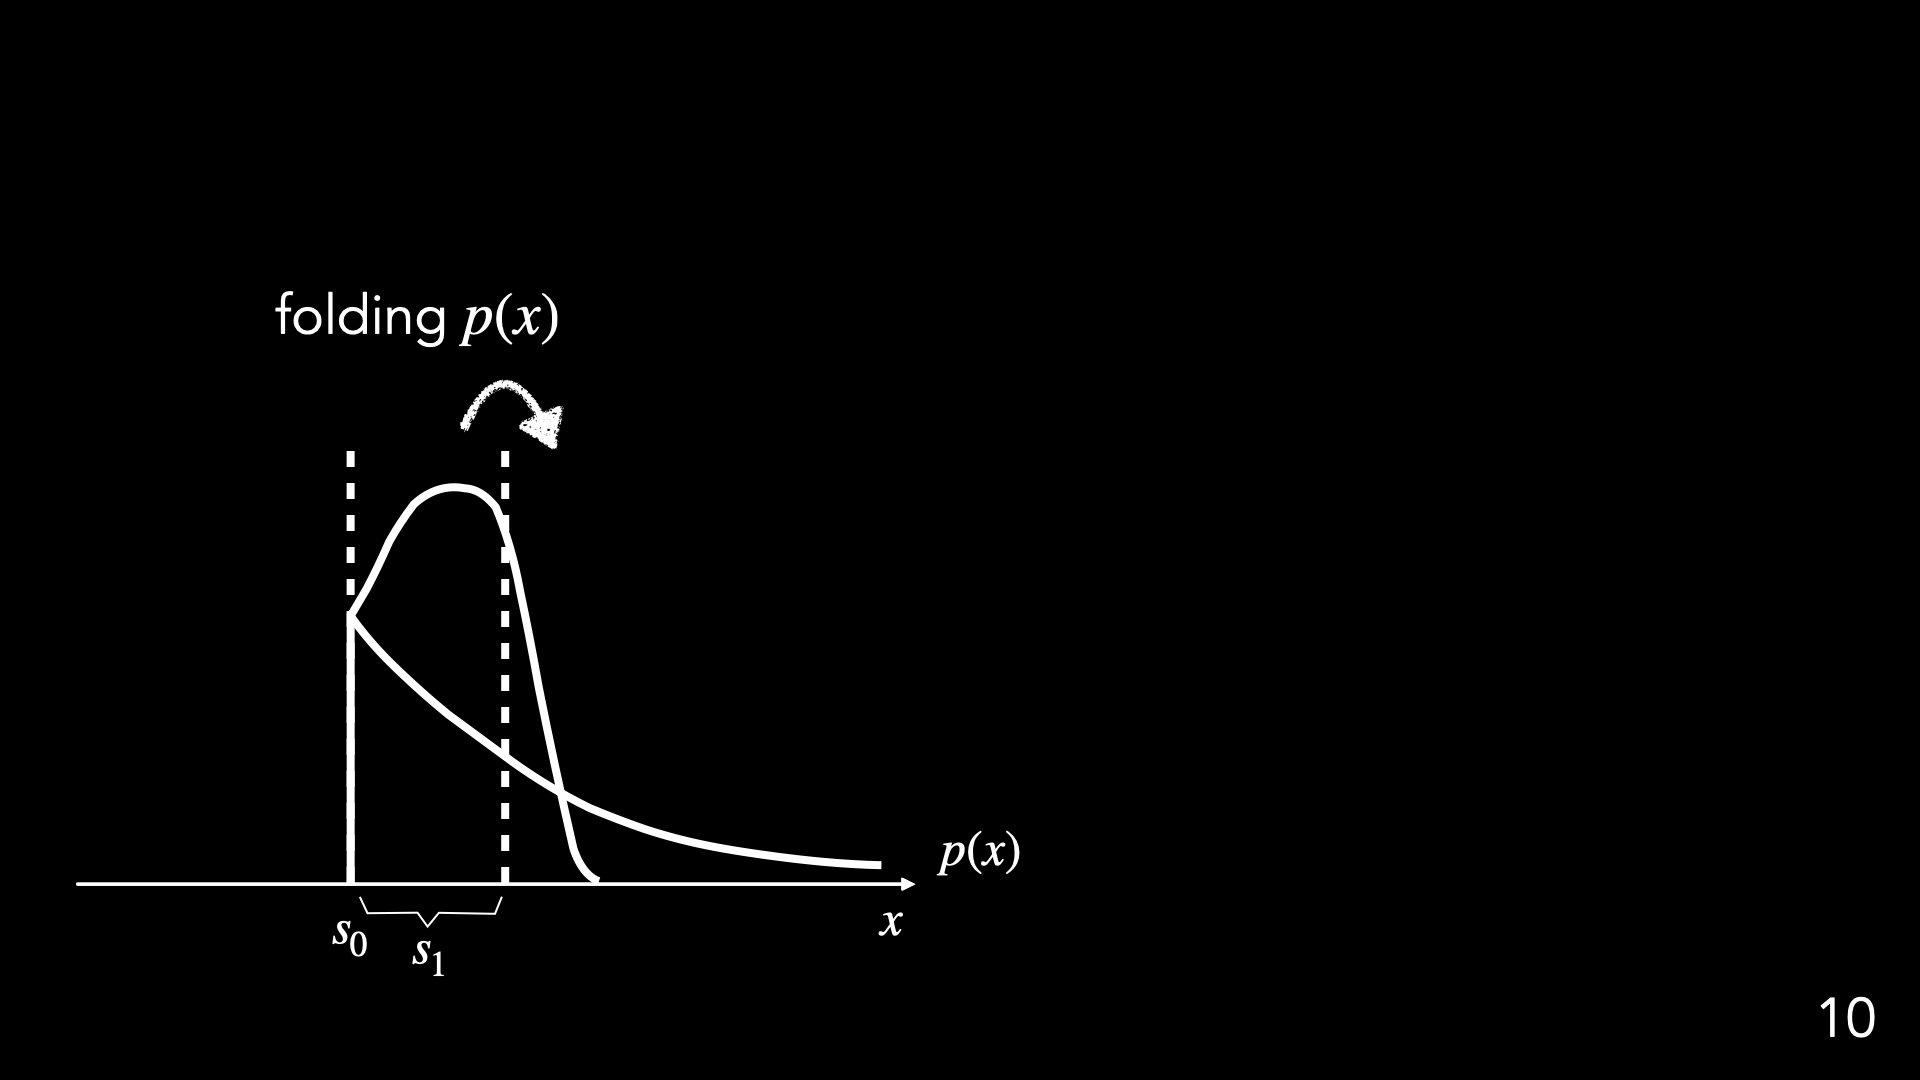
How to characterize "higher moments" via low-order operations
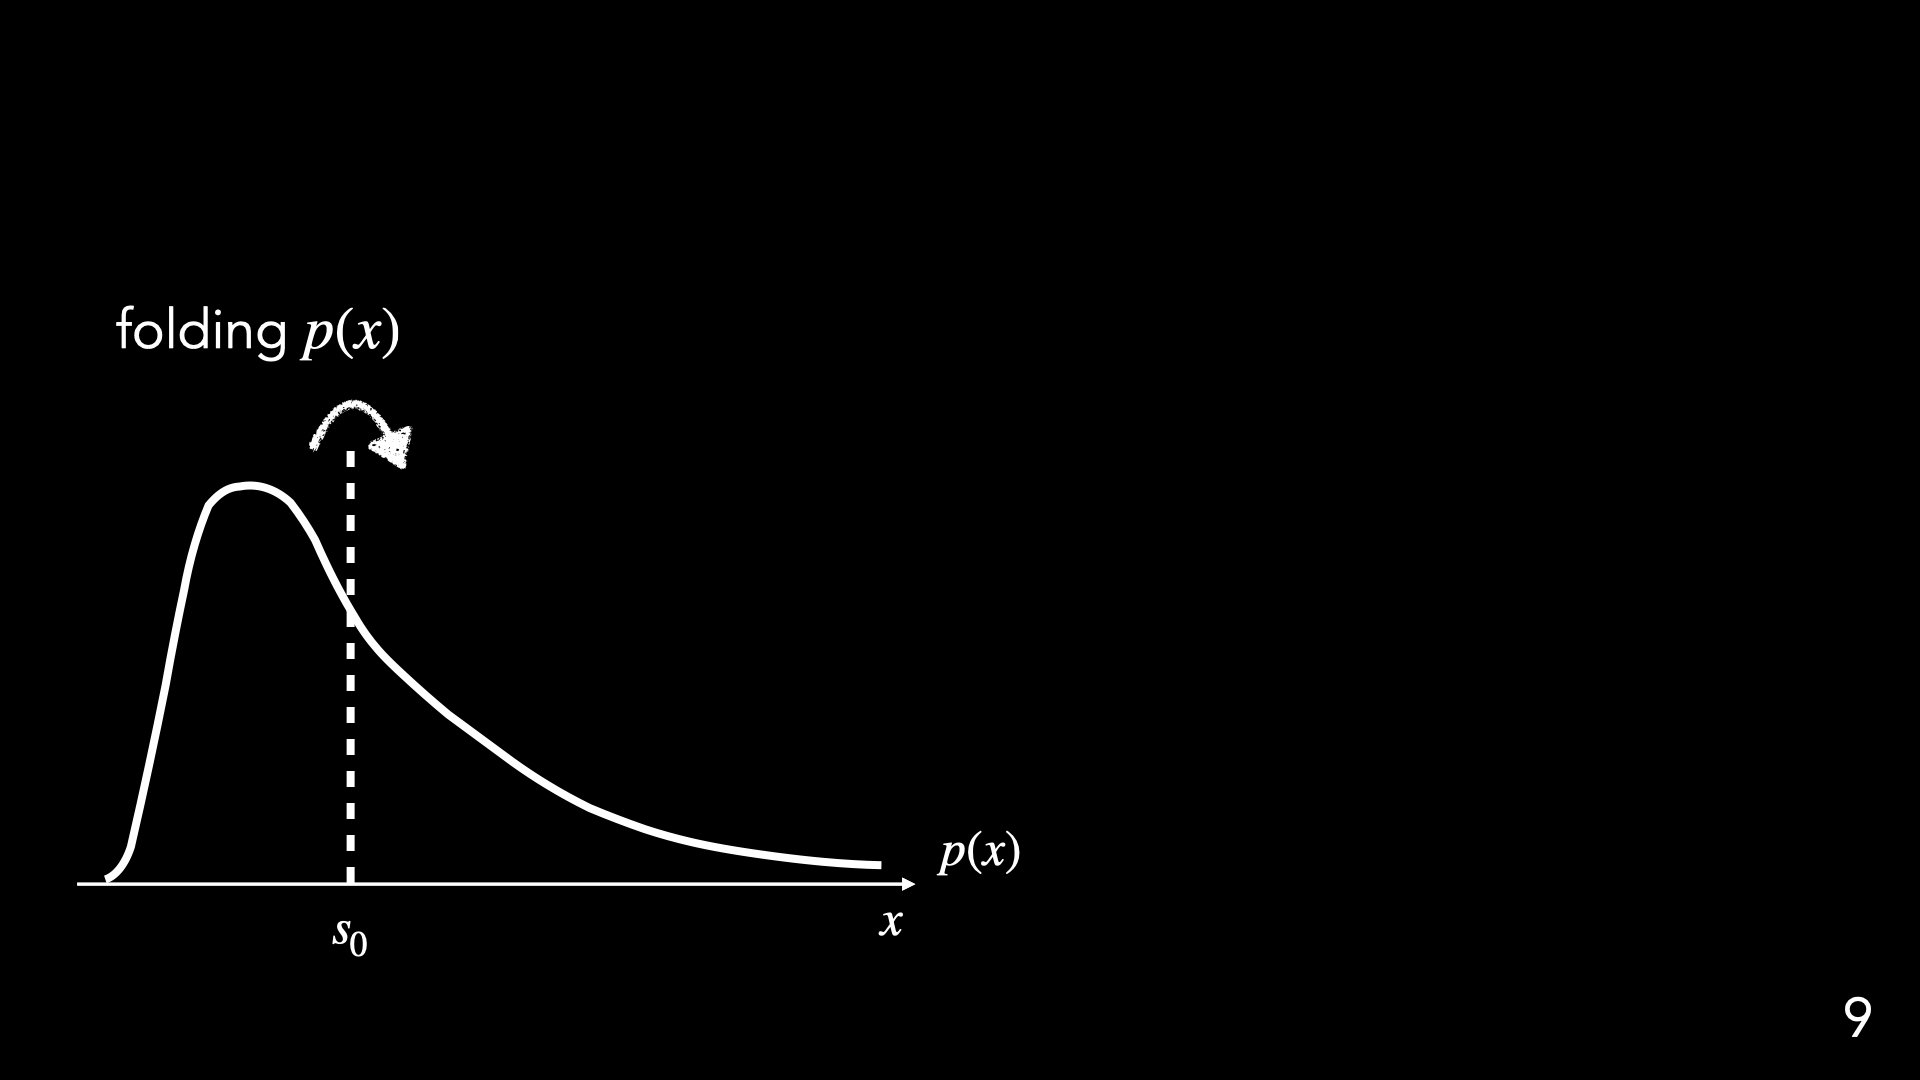
"Folding"
"Folding" = non-linear operation + averaging
"Folding"
"Folding" = non-linear operation + averaging
How to characterize "higher moments" via low-order operations
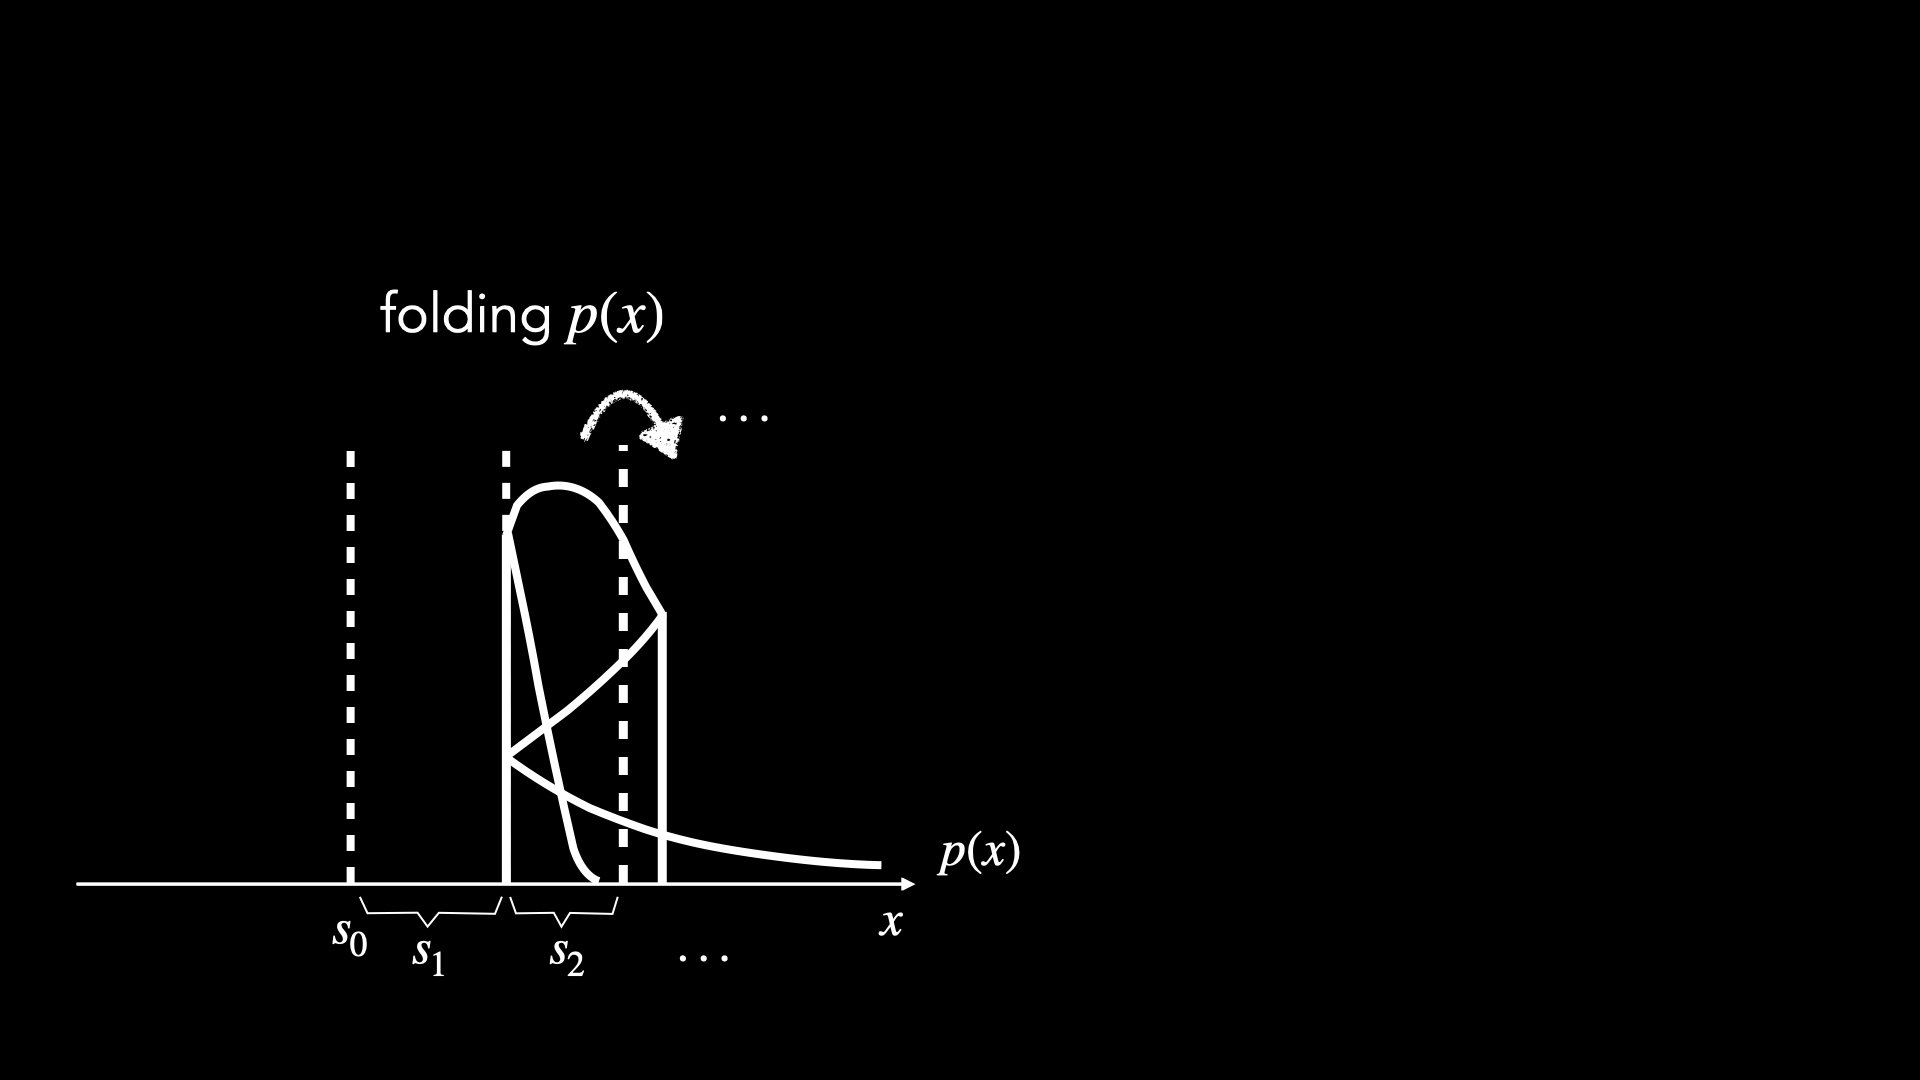
"Folding"
Linear order with respect to
stable and robust summary statistcs
How to characterize "higher moments" via low-order operations
(or "activation function")
e.g., ReLU
e.g., tanh, sigmoid
A necessary set of operations to capture high-order moments robustly
Toward an understanding of the operations in CNNs
(1) Convolution
(2) Non-linearity
(4) Iterate
(3) Averaging
Scattering transform: a better analytic tool inspired by CNNs
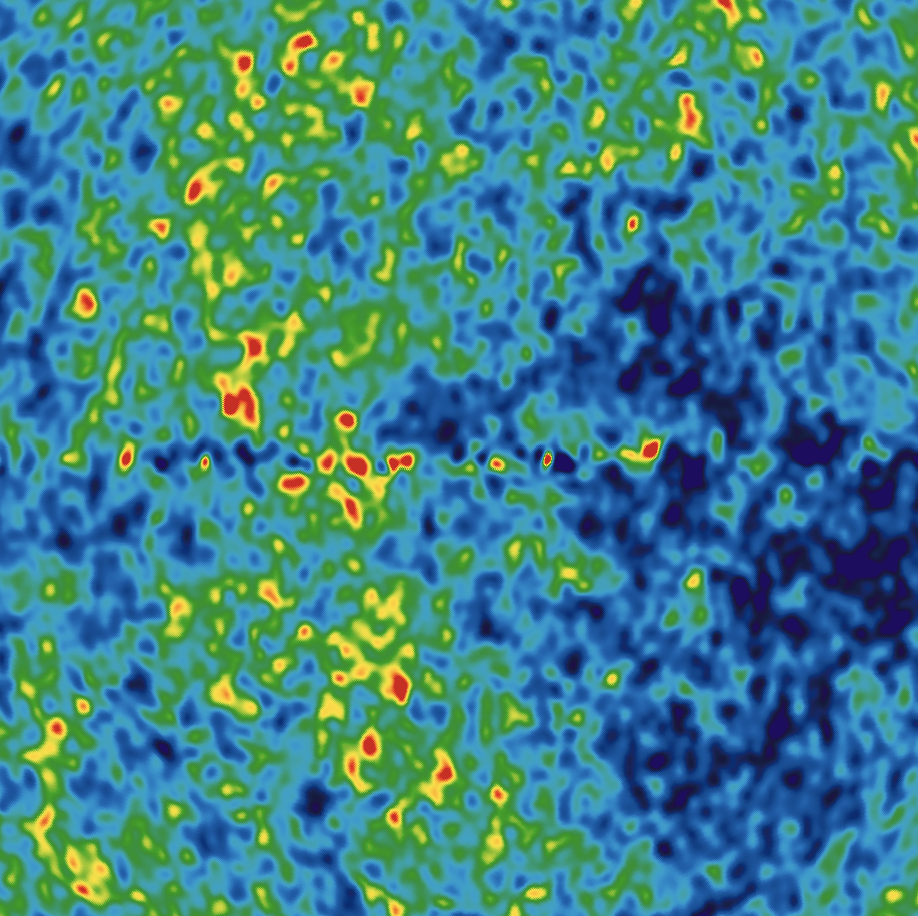
Case Study : Weak Lensing
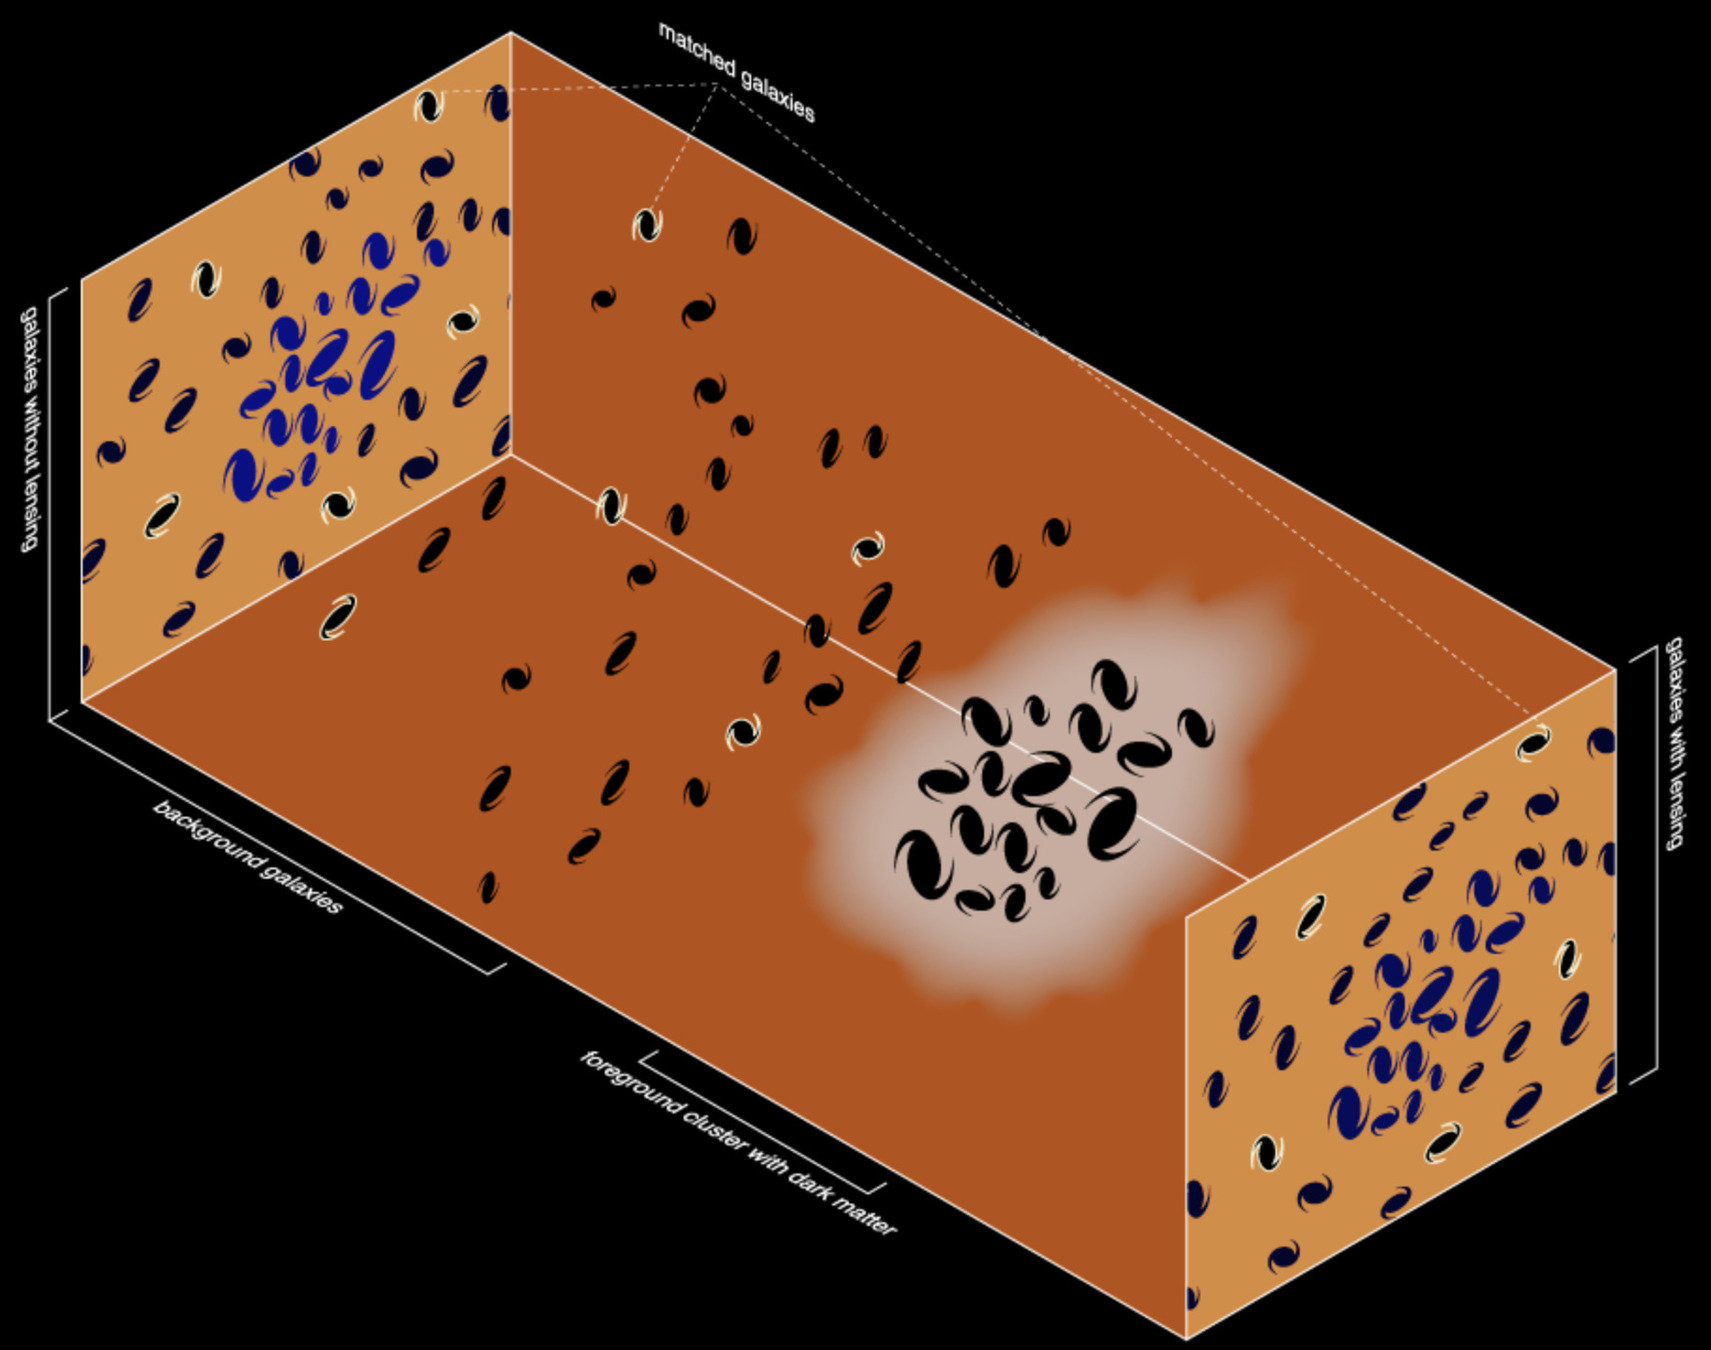
Credit: Wikipedia
Background galaxies
Foreground dark matter
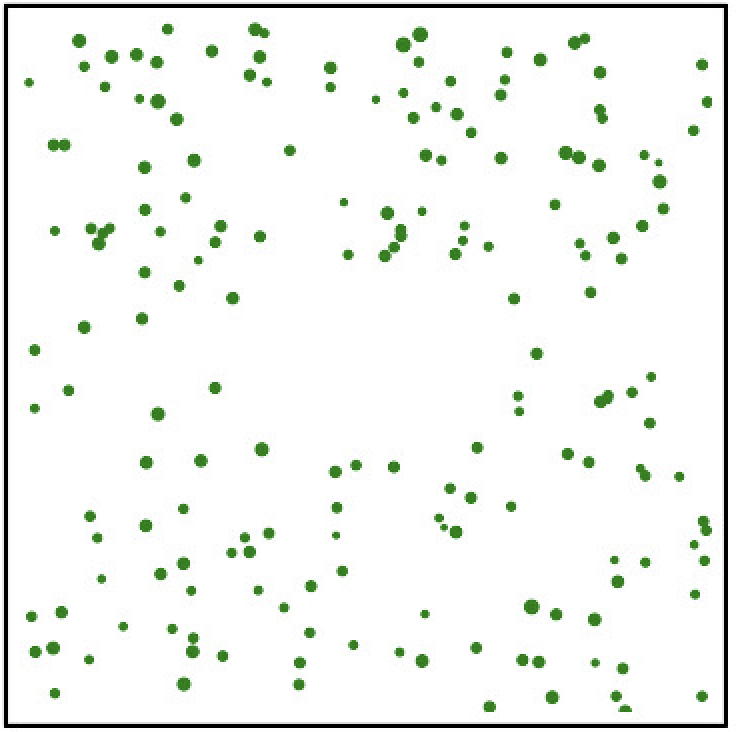
Unlensed
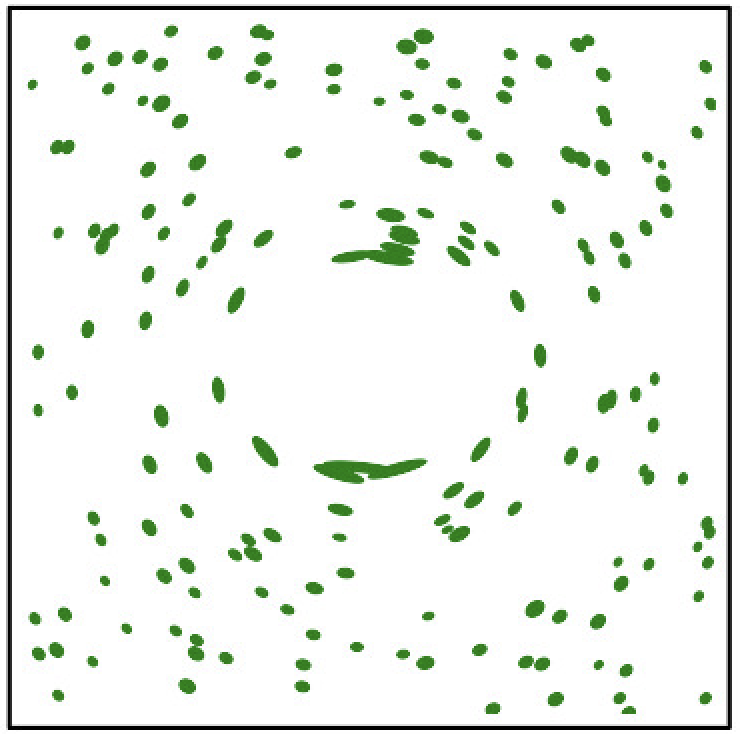
Lensed
Vary cosmological parameters
0.9
0.8
0.7
0.25
0.30
0.35
0.40
Classical summary statistics only give weak constraints
Dark Matter Density
Growth Amplitude
Power spectrum fails to distinguish the intricate differences between the two maps
Power spectrum
0.9
0.8
0.7
0.25
0.30
0.35
0.40
Power spectrum
Dark Matter Density
Growth Amplitude
Cheng, YST, Menard & Bruna + 20
Scattering
Scattering transform gives better constraints in weak lensing
Transform
International Astrostatistics Association Award
Vary cosmological parameters
0.9
0.8
0.7
0.25
0.30
0.35
0.40
Classical feature extraction only give weak constraints
Dark Matter Density
Growth Amplitude
Power spectrum fails to distinguish the intricate differences between the two maps
Power spectrum
On detecting parity violation beyond 4-point correlation function
On detecting parity violation beyond 4-point correlation function
On detecting parity violation beyond 4-point correlation function
vs.
Parity violating
Non violating
Scattering transform leads to much stronger PV detection
Craigie, Taylor, YST+ 24; Taylor, Craigie, YST+ 24
0
20
40
60
80
50
200
800
120
# Training patches of the sky
Detection Significance
Scattering Tranform
Convolutional Neural Network
Mathematics of information - better summary statistics
Generative AI - Simulation-Based Inferences
How to quantify a high-dimensional likelihood
Oh well, statistics
P ( physics | observation ) p ( observation | physics ) * p ( physics )
Describing the high-dimensional likelihood as it is
Simulation-Based Inference
with deep generative models
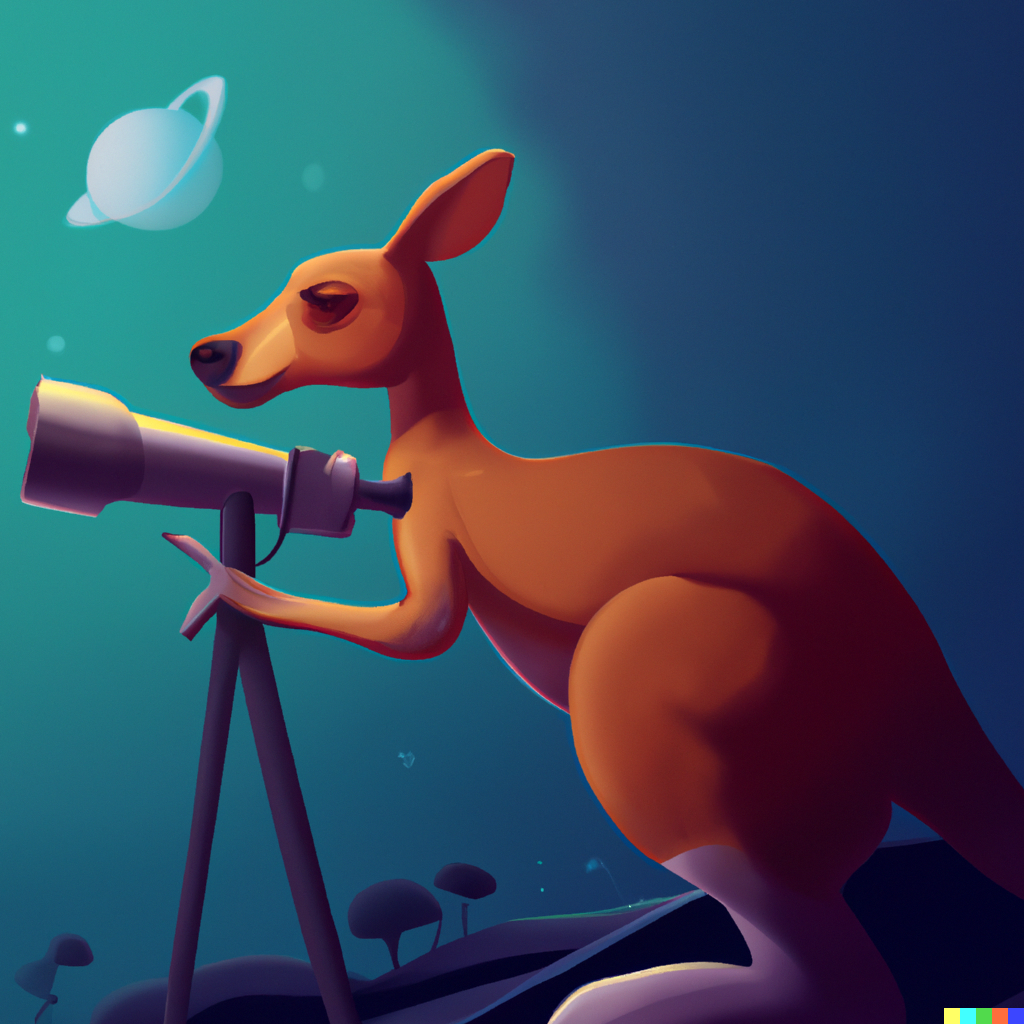
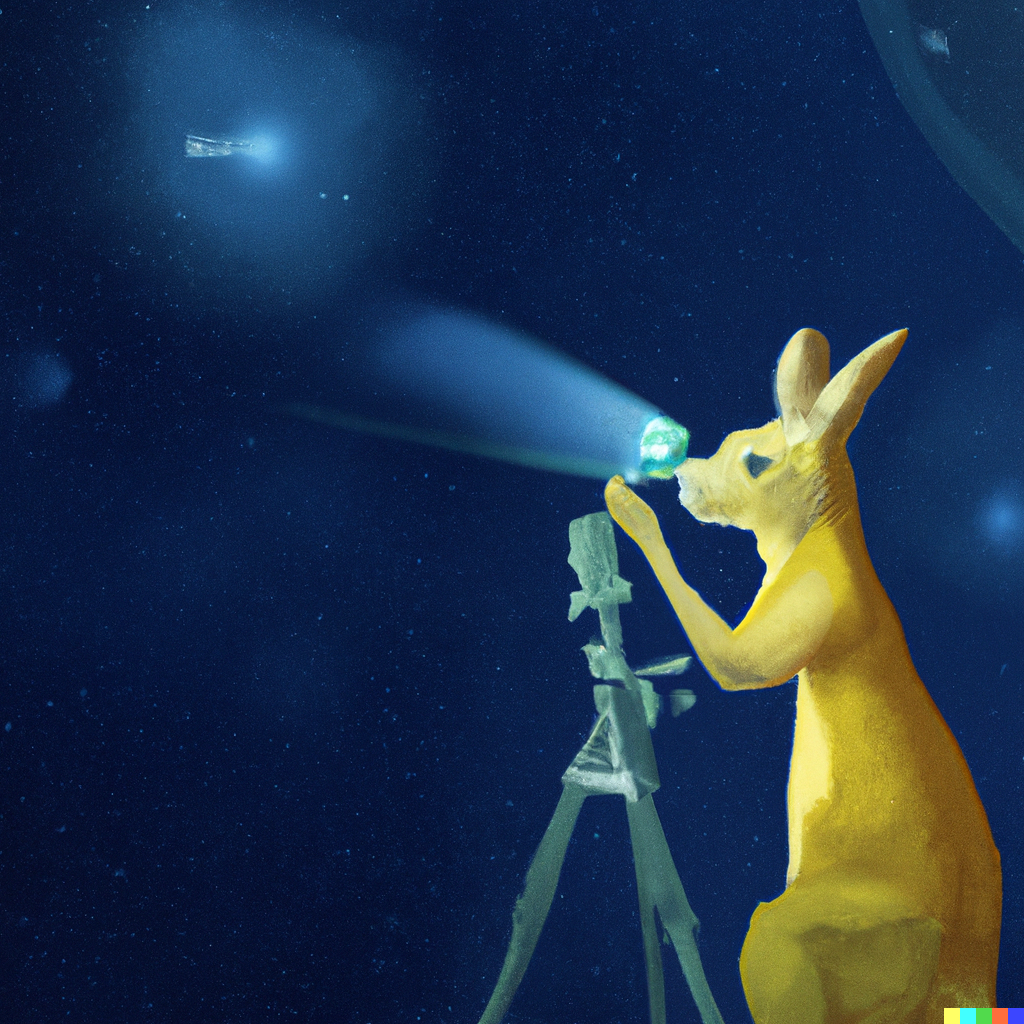
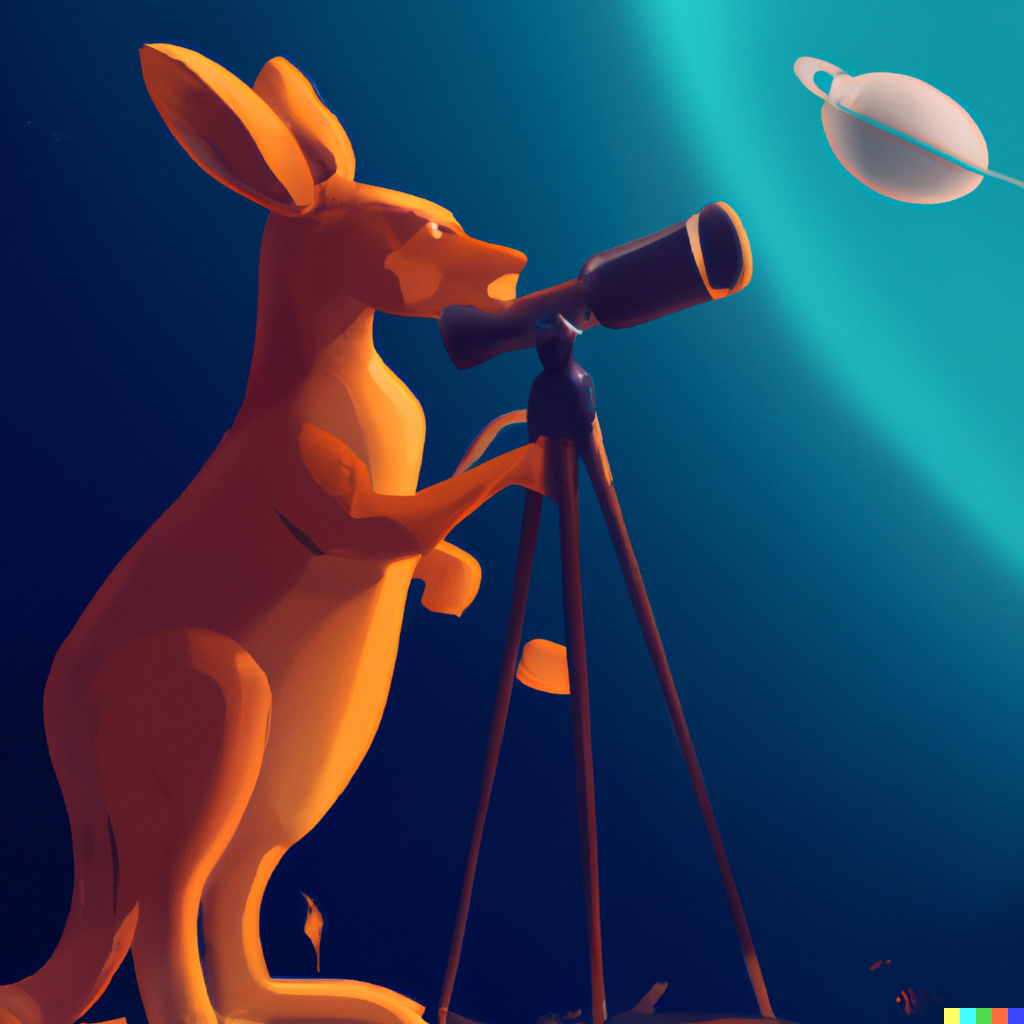
Prompt :
Kangaroo operating telescope,
looking into space
Deep generative models: generations with prompts
OpenAI's Dall-E 2
Text Prompt

Images
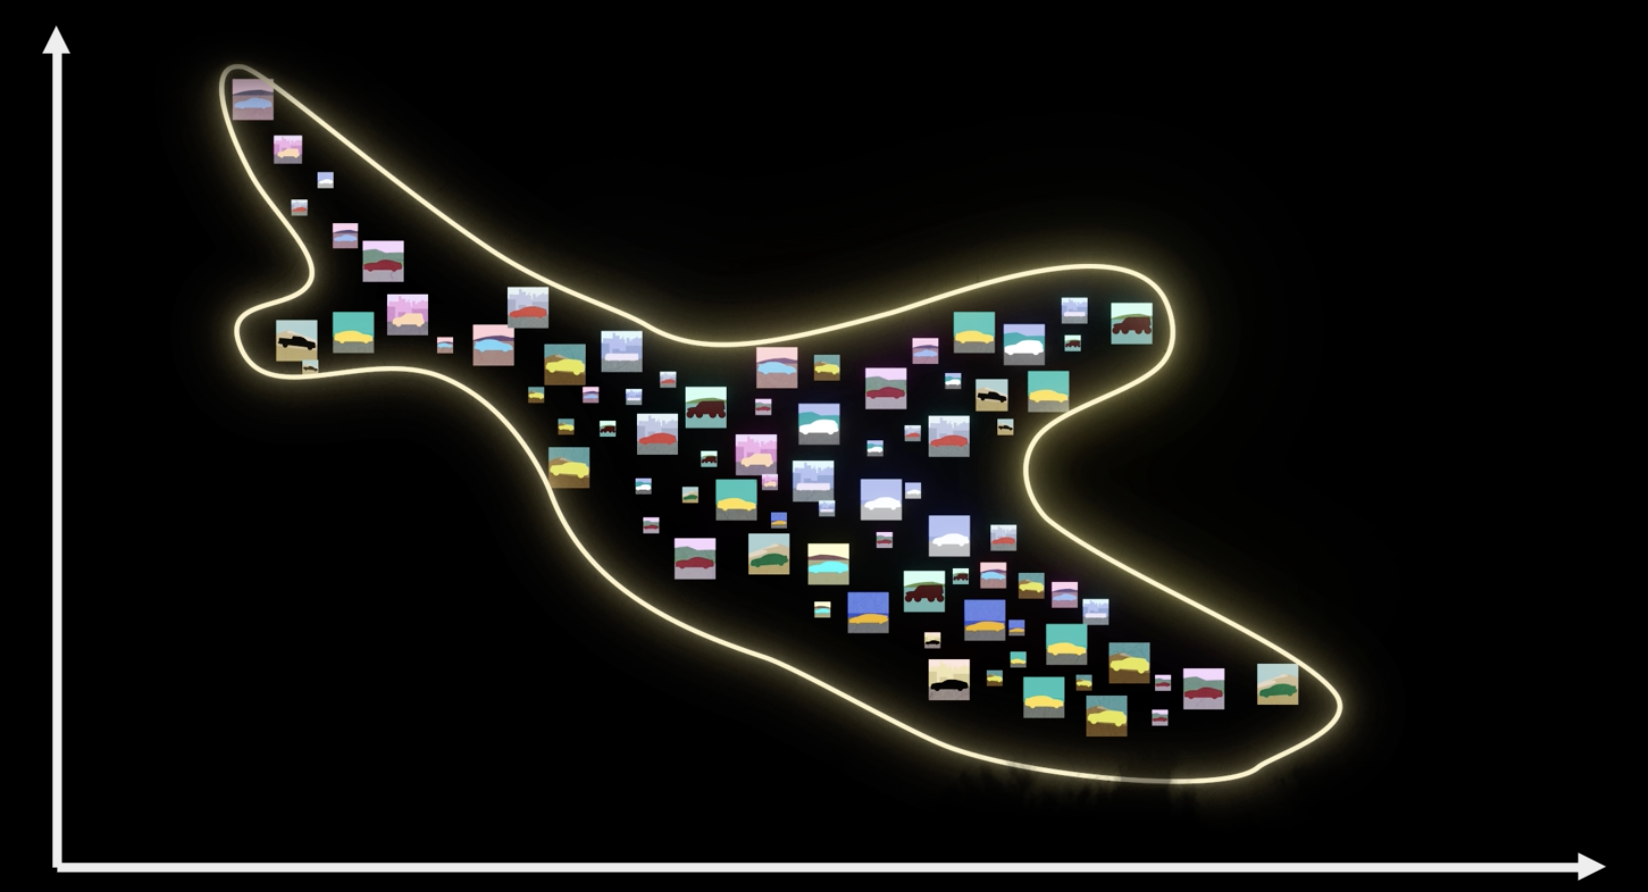
Generative models : a high-D density estimation problem
All possible images
Kangaroo operating telescope,
looking into space
Kangaroo operating telescope
Cosmological parameters
Likelihood
Posterior
Prior
Simulation-based Inferences (SBI) / Likelihood-free Inferences
Cosmological parameters
Cosmological parameters
Cosmological parameters
Images
Cosmological parameters
Text Prompt
Cosmological parameters
Learning all cosmic realizations from simulations with SBI
Deep generative models have come a long way
More dated models (e.g., GAN) are not suitable for AI x Astro
Zakharov+ 19
Generator
( machine 1)
Discriminator
( machine 2 )

Generator
Discriminator
Lack of diversity
GAN generates plausible results but suffer from mode collapse

Modern deep learning is much more resilient to mode collapse
Neural Network
Maximum Likelihood Estimation
Normalizing Flows
Diffusion Models
e.g., YST & Weinberg 21, Tang & YST 22
Assessing quantitatively the quality of generative models
Zhao, YST+ 2023
Truth (simulations)
Frechet distance:
~0.2 (truth x truth)
GAN (StyleGAN 2)
Diffusion Models (DM)
~2-2.5 (truth x GAN)
~0.4 (truth x DM)
0.9
0.8
0.7
0.2
0.3
0.4
0.5
Power spectrum
Dark Matter Density
Growth Amplitude
Dai & Seljak, 2022
Normalizing Flow
Constraining weak lensing cosmological parameters with SBI
The idea of simulation-based inferences goes beyond just the study of cosmology

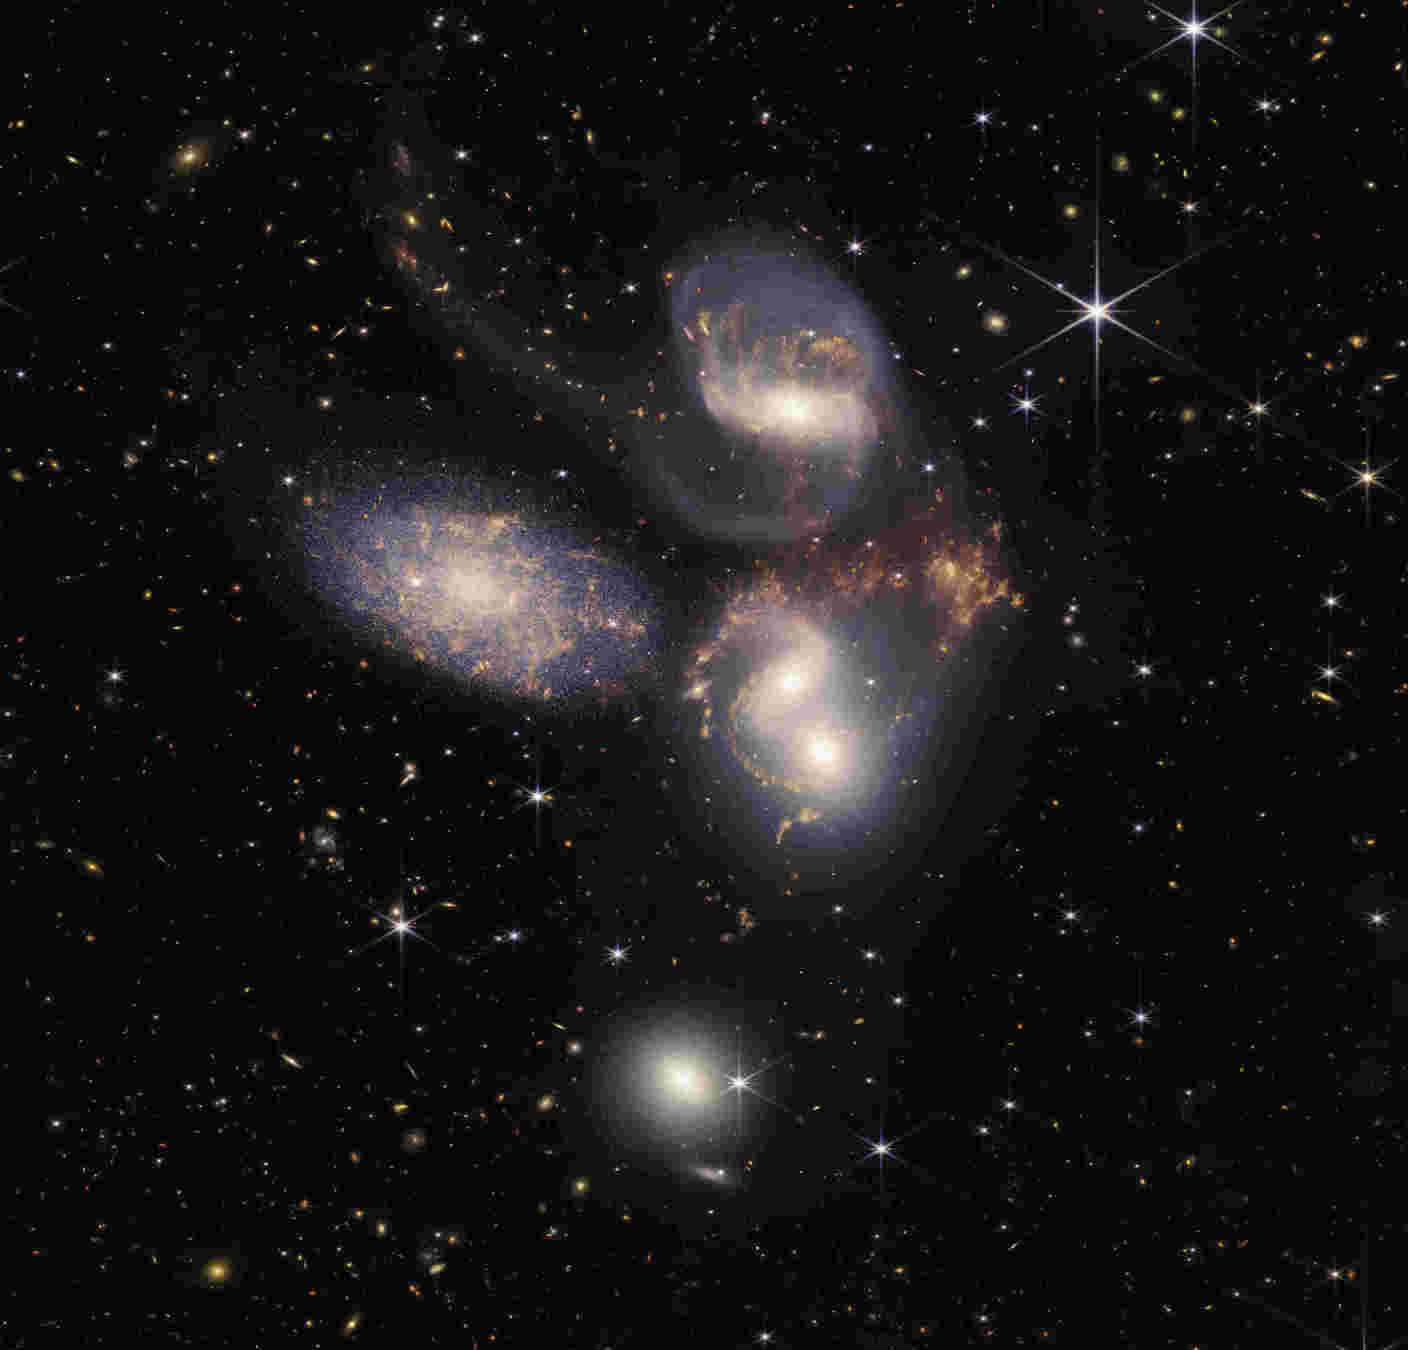
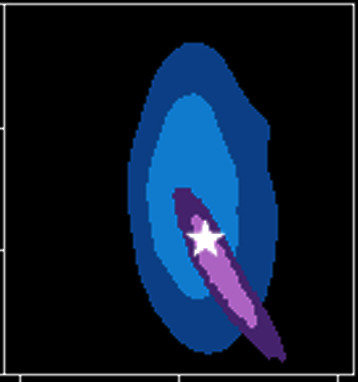
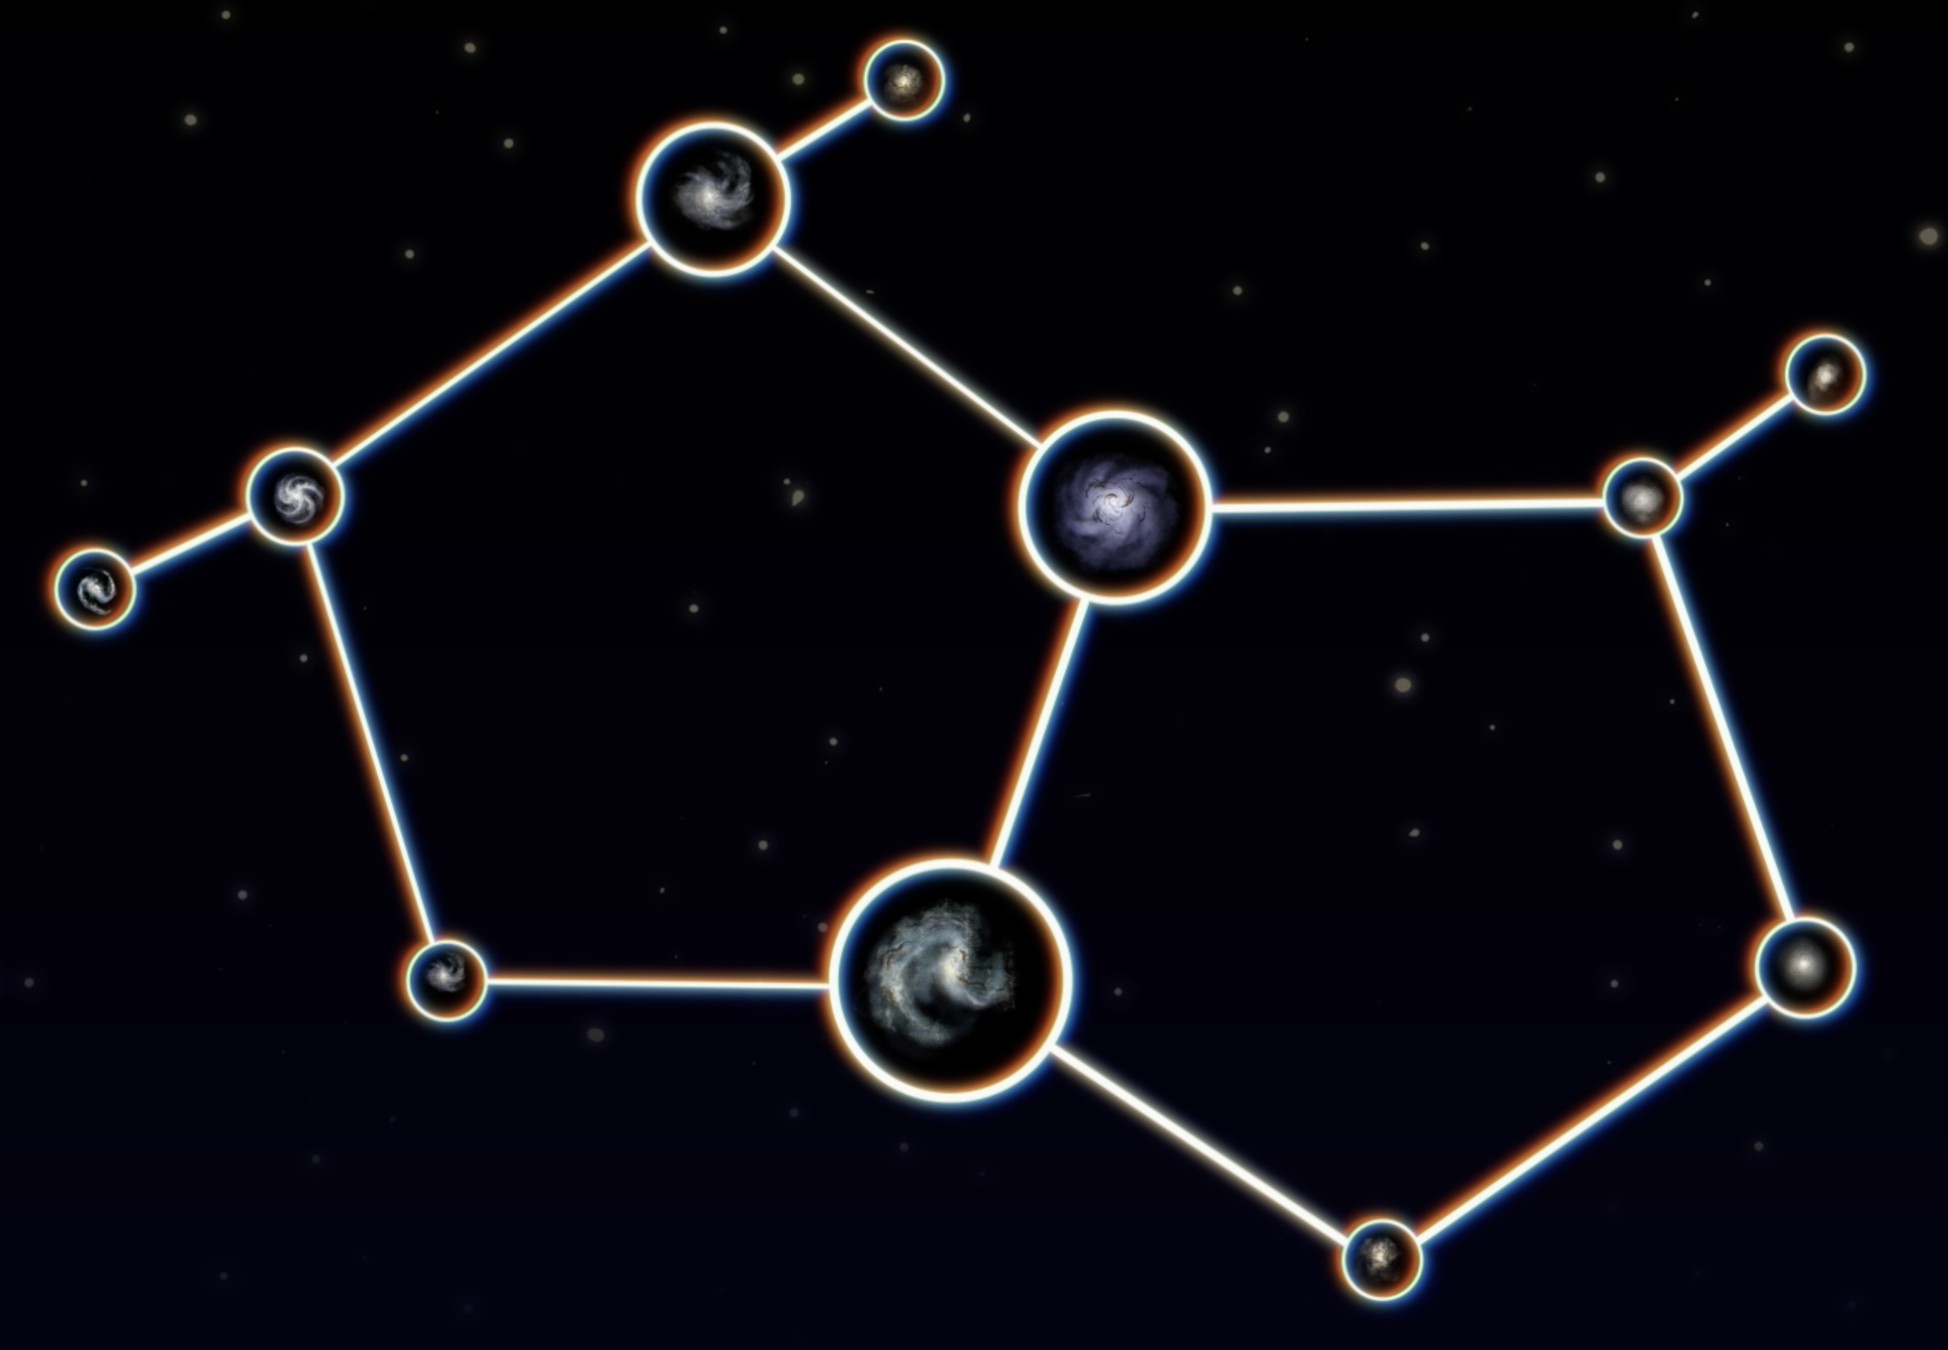
Present day galaxies - results of galaxy merger events
A shameless promotion of 1990s Japanese anime
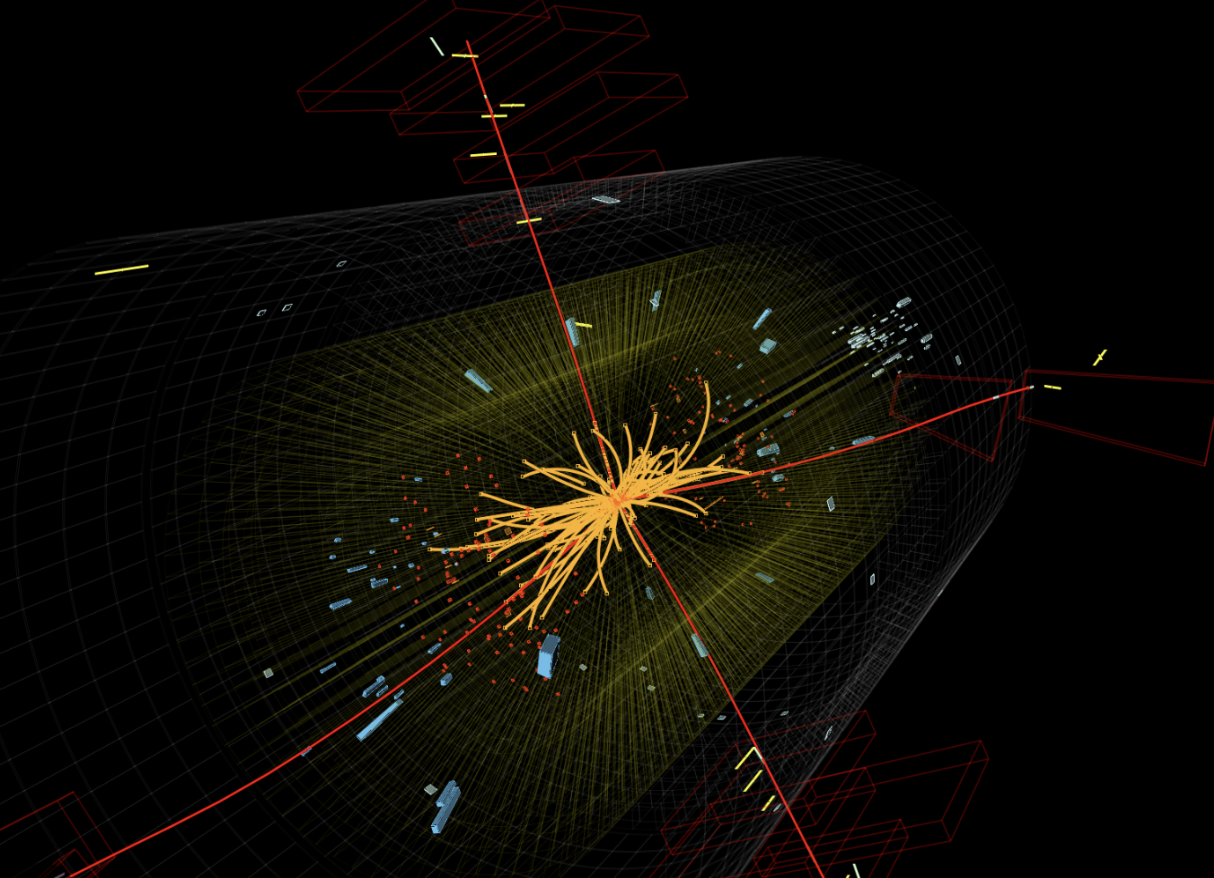
Image = fixed dimension
Dealing with graphs is challenging - varying dimensionality
Graph = varying dimension
Dealing with graphs is challenging - huge redundancy
Graph deep generative models have drastically improved
Blackhole mass
Blackhole accretion
Gas metallicity
Stellar metallicity
Stellar mass
Rotational curve vmax
Velocity dispersion
Stellar mass
For individual nodes :
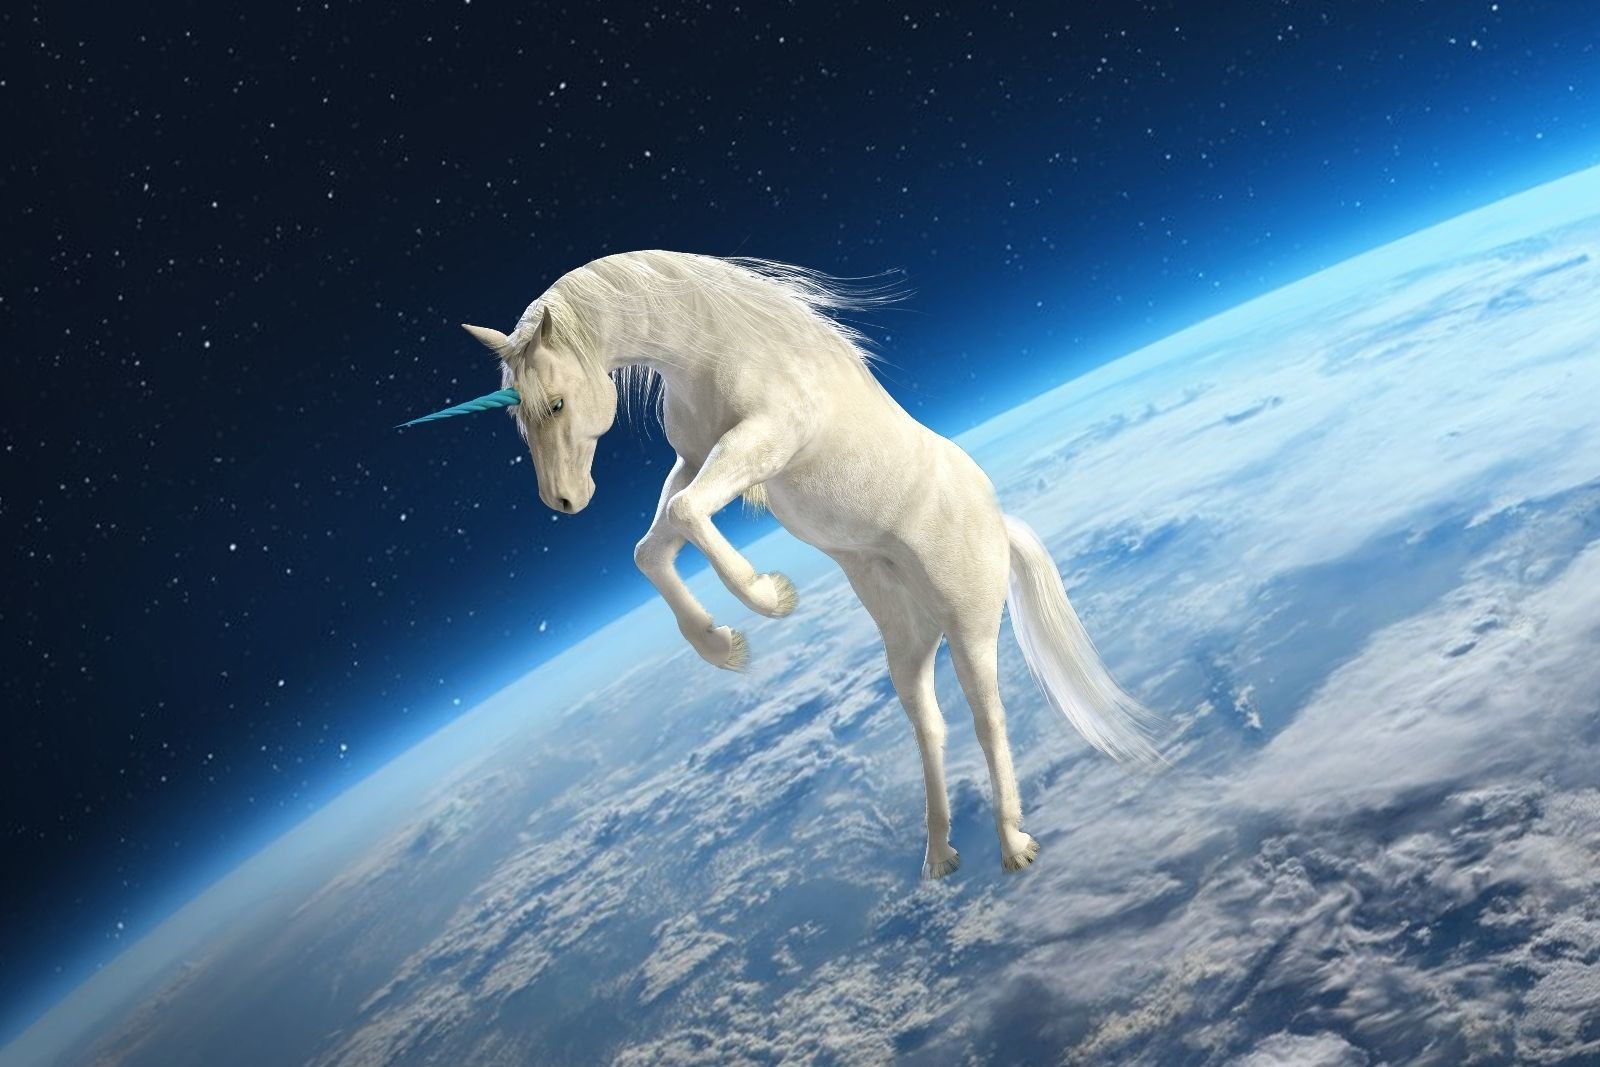
Merging redshift
Pairwise distances
Tang & YST, 2022, ICML W Spotlight
present day
10 billion years ago
Distilling knowledge from cosmological simulations
Likelihood
Posterior
Prior
Simulation-Based Inferences with galaxy progenitor systems
Simulation-Based Inferences with galaxy progenitor systems
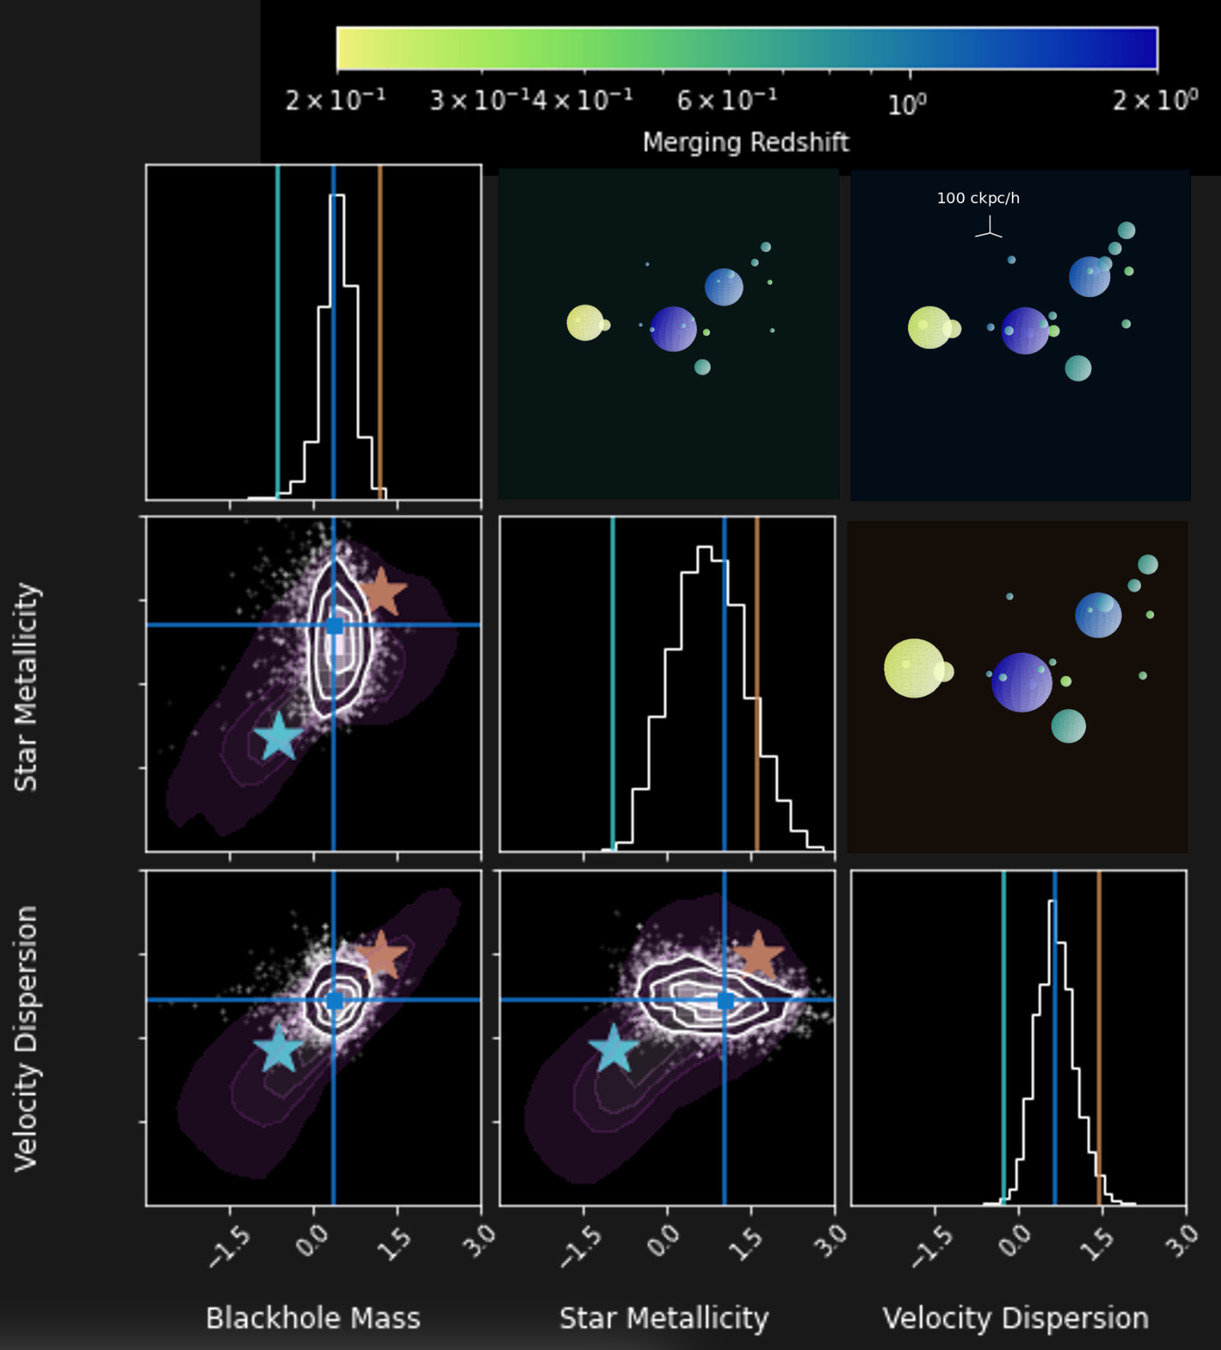
Stellar
Metallicity
Velocity
Dispersion
Blackhole
Mass
Stellar
Metallicity
Velocity
Dispersion
0.2
0.3
0.4
0.6
1.0
2.0
Merging Redshift
Tang & YST, 2022
Normal
Outlier
Likelihood =
Out-of-distribution ( outliers ) detections
Normal
Outlier
Log likelihood
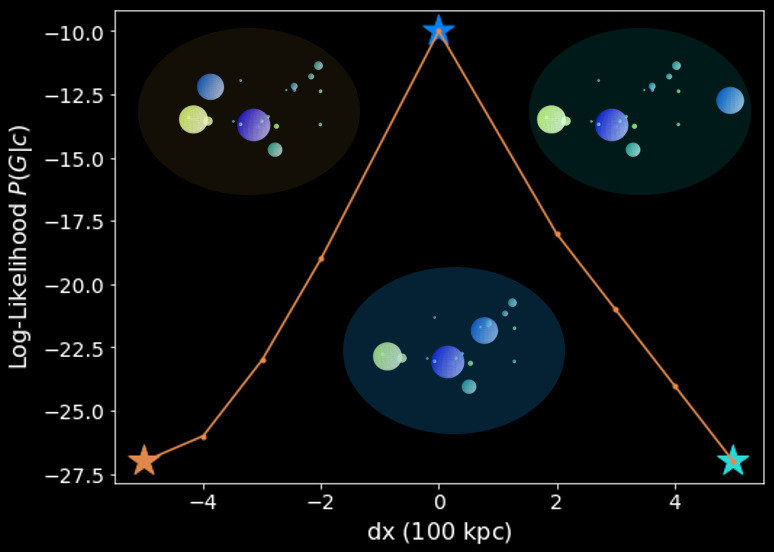
Displacement [ 100 kpc ]
Simulated system
0.2
0.3
0.4
0.6
1.0
2.0
Merging Redshift
Tang & Ting, 2022
Out-of-distribution ( outliers ) detections
Normal
Outlier
Log likelihood
Out-of-distribution ( outliers ) detections
Displacement [ 100 kpc ]
Tang & Ting, 2022
Summary :
Modern-day large surveys have revealed ever more complex patterns and structures
Classical astrostatistics tools struggle to deal with high-dimensional non-Gaussian observations
Summary :
Mathematics of information from ML has led to powerful analytic tools (e.g., scattering transform) to characterize complex systems
The success of deep generative models provides new possibilities to directly compare simulations with observations
Modern-day large surveys have revealed ever more complex patterns and structures
Classical astrostatistics tools struggle to deal with high-dimensional non-Gaussian observations
Extra Slides
Cosmic Reionisation
Cosmology
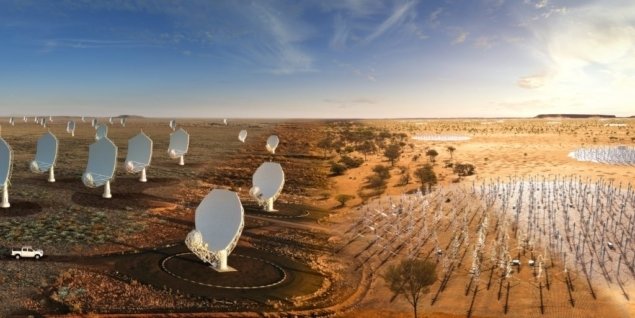
Imaging the cosmic dawn/reionisation with SKA
Length [ Mpc ]
0
50
100
150
200
250
0
50
100
150
200
250
0
50
100
150
200
250
Scattering transform yields 3x stronger constraints for SKA
Power spectrum
Scattering transform
0.0
Fraction of gas in galaxies, and
Ionization photon escape fraction, and
Greig, YST & Kaurov, 22, 23
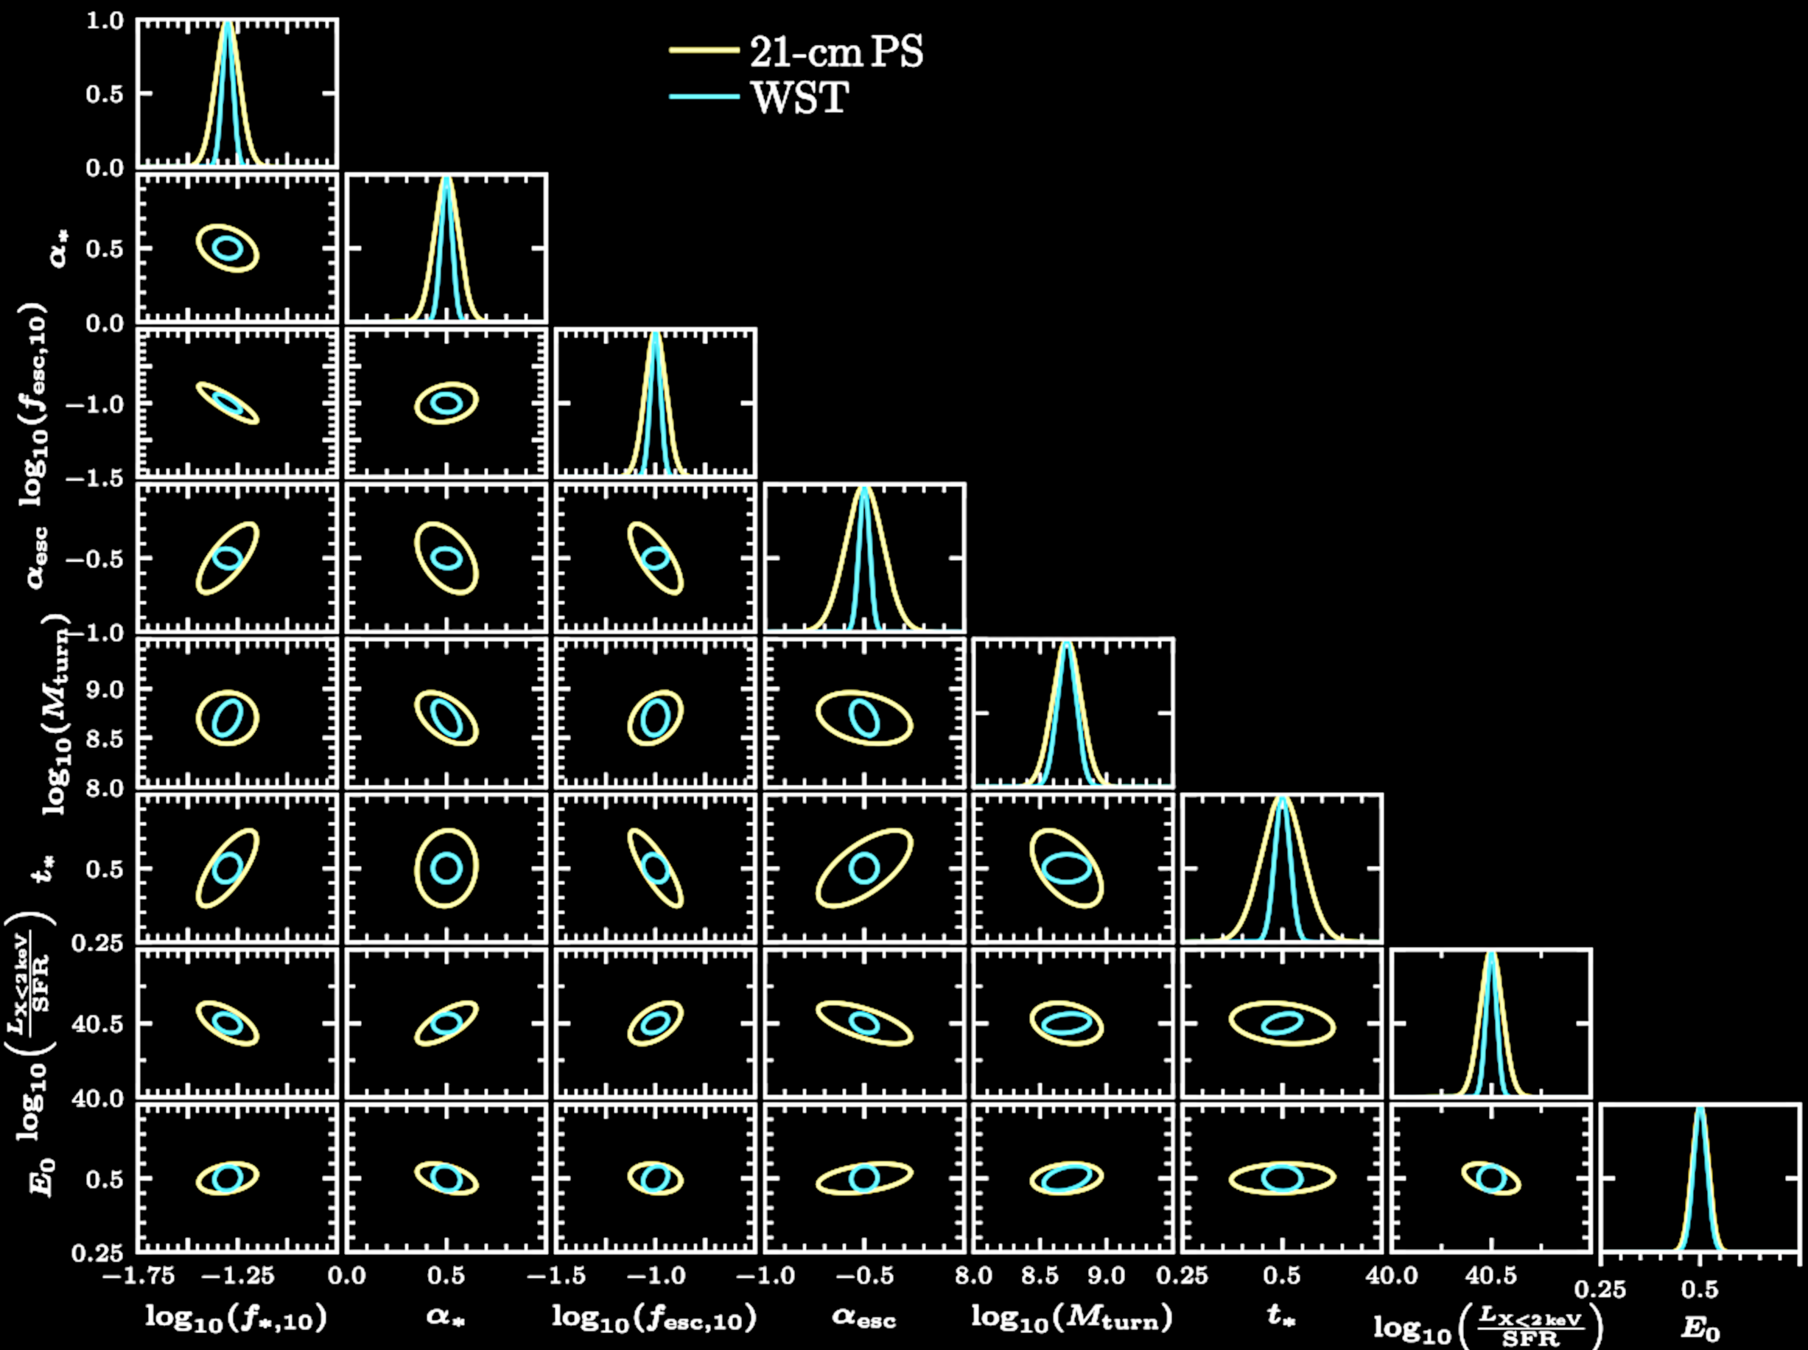
its dependence on the halo mass
its dependence on the halo mass
Galaxy mass below which star formation is suppressed
Star formation evolution time scale
Emisitivity in X-ray
X-ray escape threshold
However observation is of high dimensional ...
Asteroseismology
P ( physics | observation ) p ( observation | physics ) * p ( physics )
Very high dimensional
The bottleneck of astrostatistics ...
Observation
Physics
Summary Statistics
Characterizaton
Theory
The bottleneck of astrostatistics ...
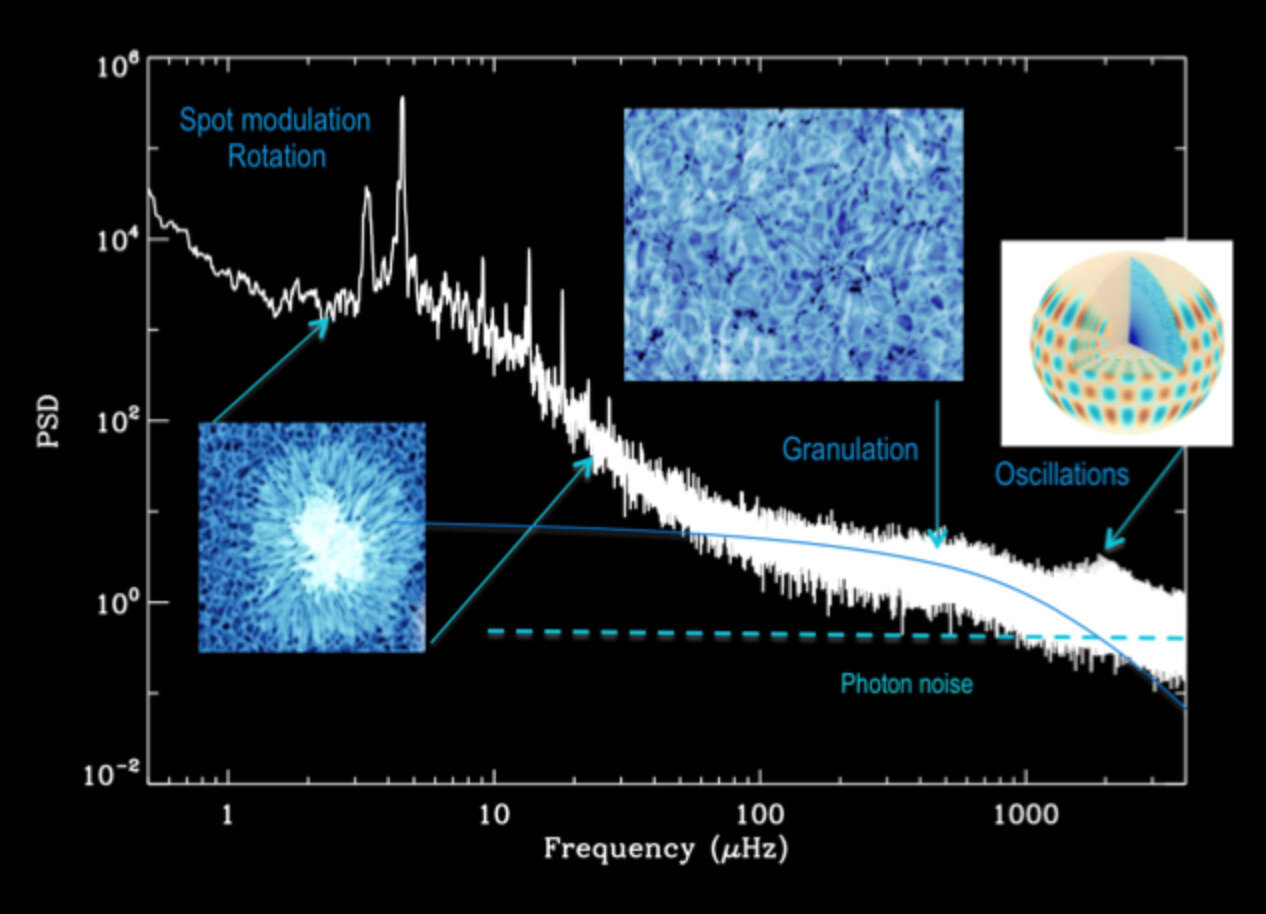
Frequency
Power Spectral Density
Oscillation
Granulation
P ( physics | observation ) p ( observation | physics ) * p ( physics )
Observation
Physics
Summary Statistics
Theory
Imperfect physics
= Information Loss
Characterizaton
Why the hype with deep learning ?
Curse of Dimensionality
Deep Learning
Curse of dimensionality: a exponentially large data set is needed
DL can describe high-dimensinoal space with a finite data
Underlining the success of deep learning are symmetries
Symmetries make deep learning more sample efficient
"I suppose it is tempting, if the only tool you have is a hammer, to treat everything as if it were a nail"
Abraham Maslow
Power Spectrum
Convolutional Neural Networks
Scattering Transform
15 coefficients
37 coefficients
10
100
1000
noiseless
DES
figure of merit
Galaxy number density
performance is on par with
Scattering transform's
CNNs
Better
Euclid / CSST / Roman
Rubin
Complexity
Stochasticity
Human heuristics
( power spectrum )
(or "structures")
("uninformative" variances)
Scattering Transform
Gaussian
Non-Gaussian
Simple
Complex
Credit: Shangjia Zhang, Zhaohuan Zhu
Characterizing the protoplanetary disk observations
Yuan, YST+ in prep.
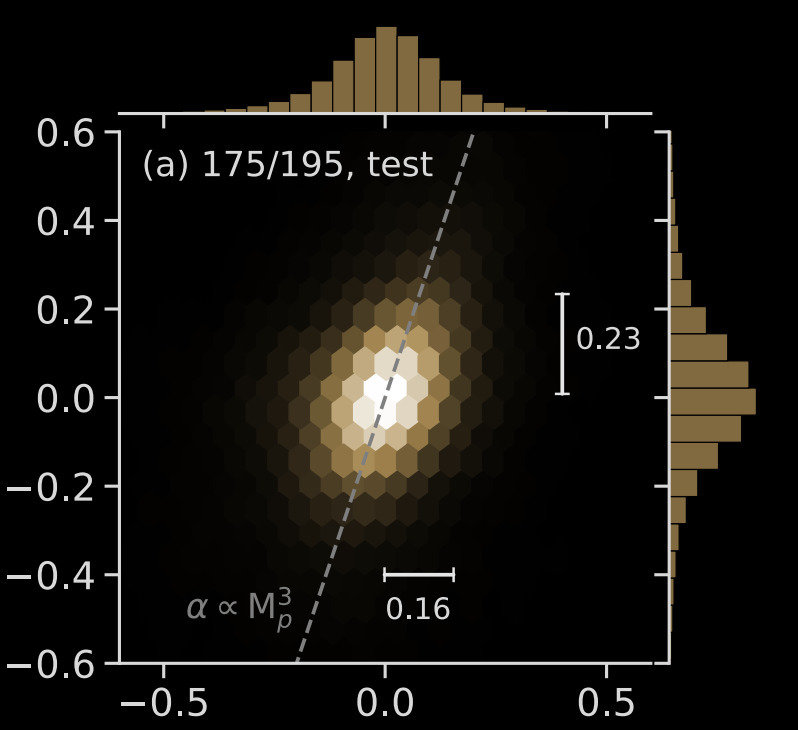
Log Planet Mass [ inferred - truth ]
Log Viscosity [ inferred - truth ]
Zhang+22
This study
( Scattering Transform)
0.11
0.14
Characterizing the protoplanetary disk observations
Mock data
A theoretical understanding of deep learning
makes a big difference

Neural Networks
Observation
The ML tool with the relevant symmetries

Blindly applying machine learning
Classical tool
(e.g., power spectrum)
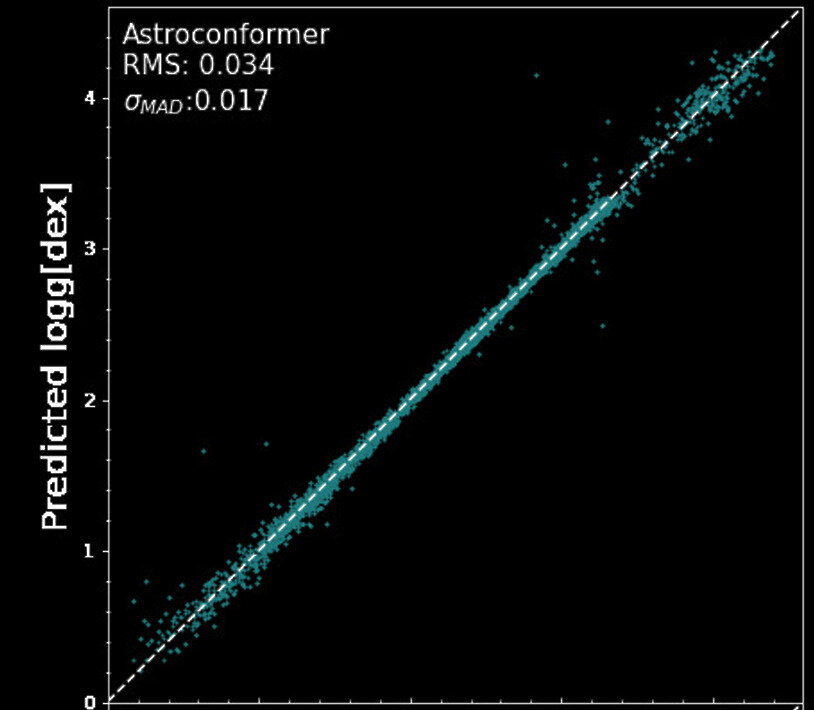
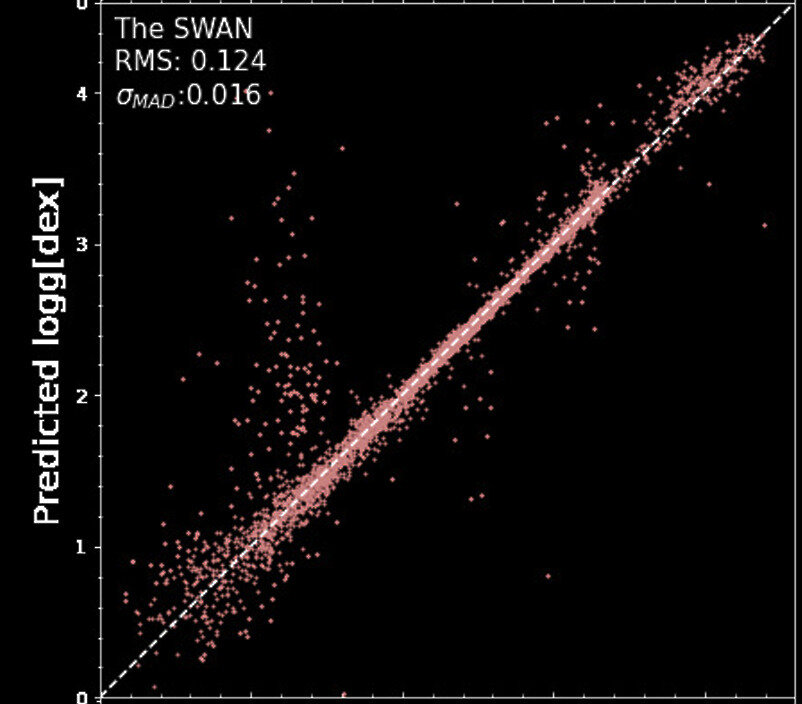
stellar interior,
surface gravity
Convolutional
Neural Network ???
(e.g., Hon+17,18, Blancanto+22)
CNNs do not have the right "inductive bias" for time series
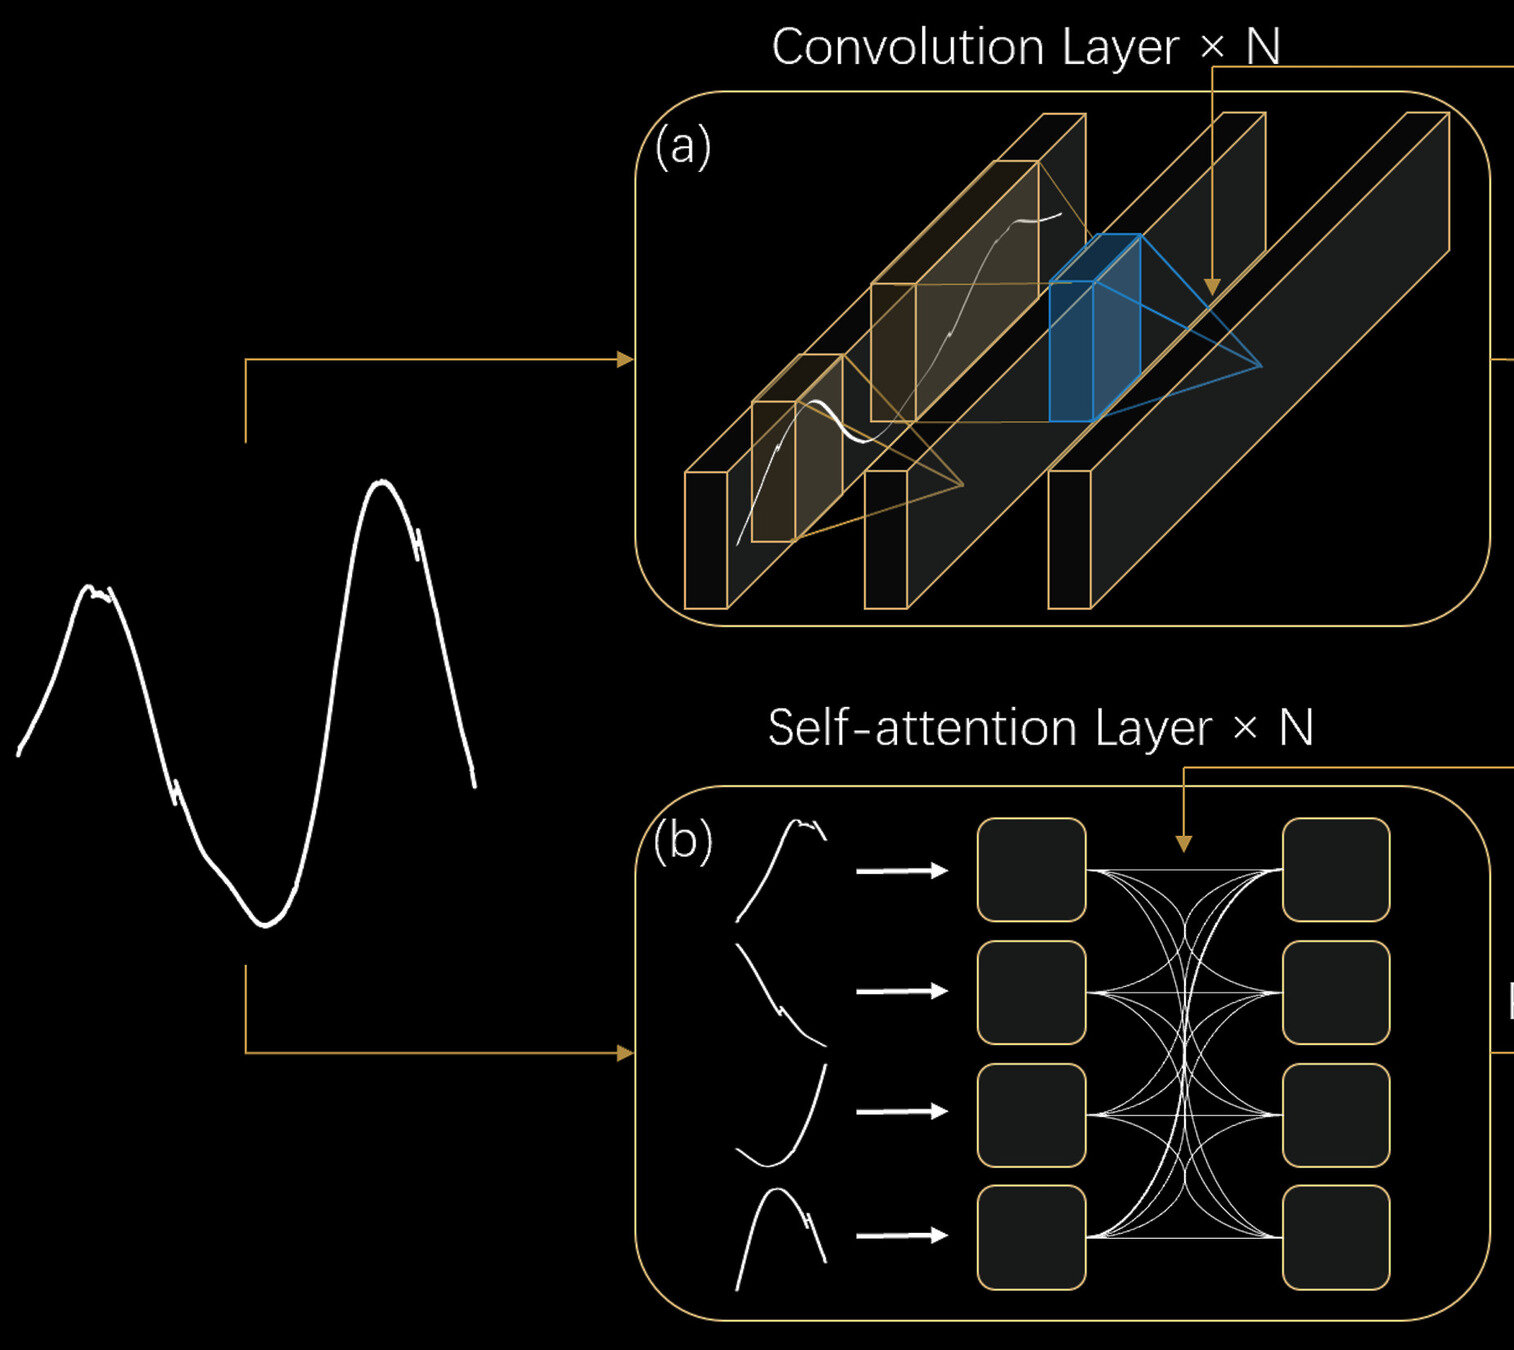
Convolutional Neural Networks
Local perceptive field
Transformer
Long-range information
The cat sat on the mat and licked its paws
在这深宫之中,你我皆是棋子,有时你在用我,有时我在用你,唯有互相利用,方能在这混乱的权力游戏中求得一线生机。
The foundation of Large Language Models: Attention
The foundation of Large Language Models: Attention
Extracting long-range information from stellar light curves
Pan, YST & Yu 22, 24
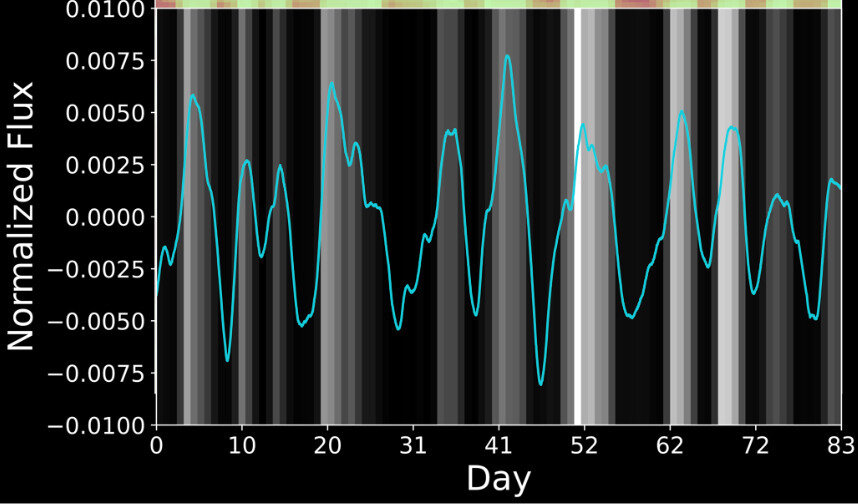
Kepler's Light Curve
Transformer models surpass state-of-the-art algorithms
Kepler's Light Curve
0
1
2
3
4
0
1
2
3
4
Ground Truth Surface Gravity
0
1
2
3
4
Inferred Surface Gravity
State-of-the-art
This study
Pan, YST & Yu 22, 24a
Precise inductive bias drives the development of scalable models
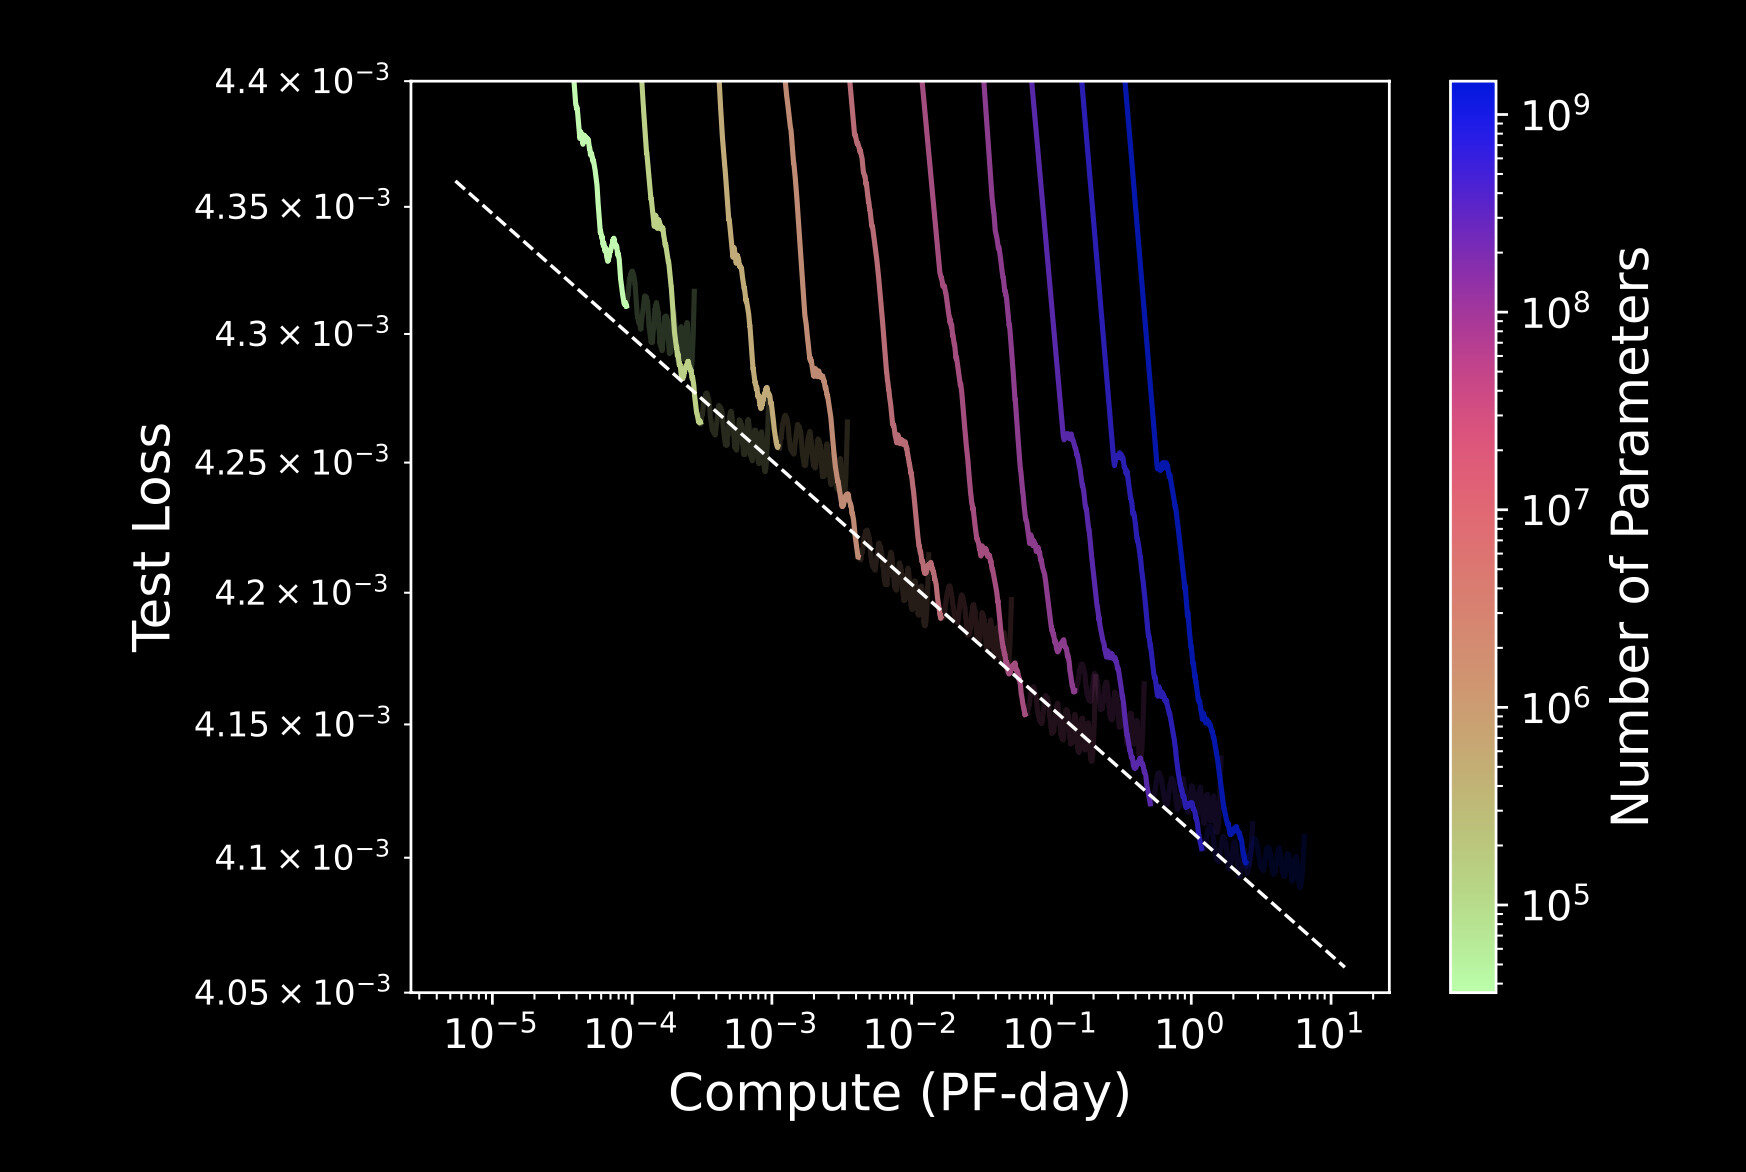
Neural Scaling Law also
applies to astronomical
time series data
Pan, YST & Yu, 24b
Open-AI, 2023
We can forecast and extrapolate the performance
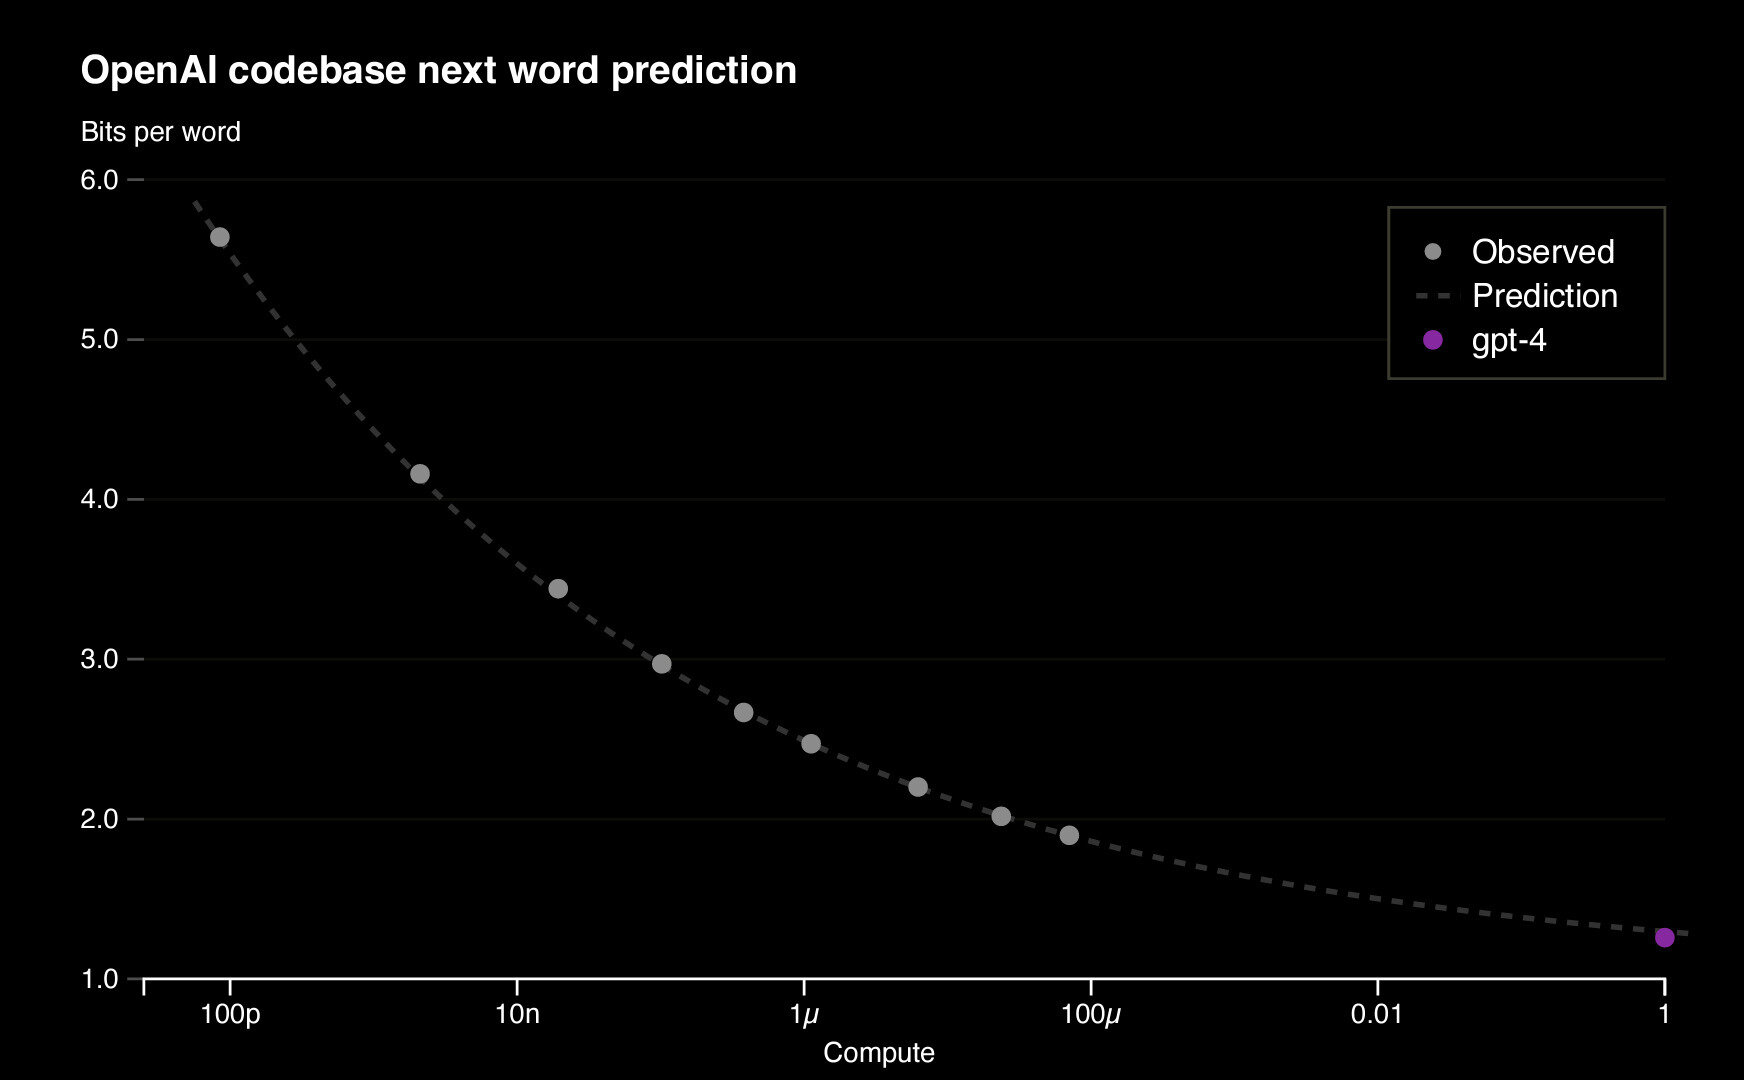
"Model Size "
Performance
Know your inductive biases
Spectra also contain long-range information
Transformers result in improved generative models for spectra
4500
4600
4700
4800
4900
5000
Wavelength [A]
Generative Residual [dex]
-0.02
0
0.02
0
-0.1
0.1
-0.02
0
0.02
Transformers
Convolutional Neural Networks
Multi-Layer Perceptron
Rozanski, YST+ 2024
Transformers also exhibit no signs of saturation during training
The more computing power we can allocate, the more the models will continue to improve
Number of Training Steps
10
3
10
4
10
5
10
6
Mean Absolute Error
10
-2
10
-1
Transformers
Multilayer-Perceptron
Transformers
CNN
Rozanski, YST+ 2024
Extracting Information from Low-Resolution DESI Spectra
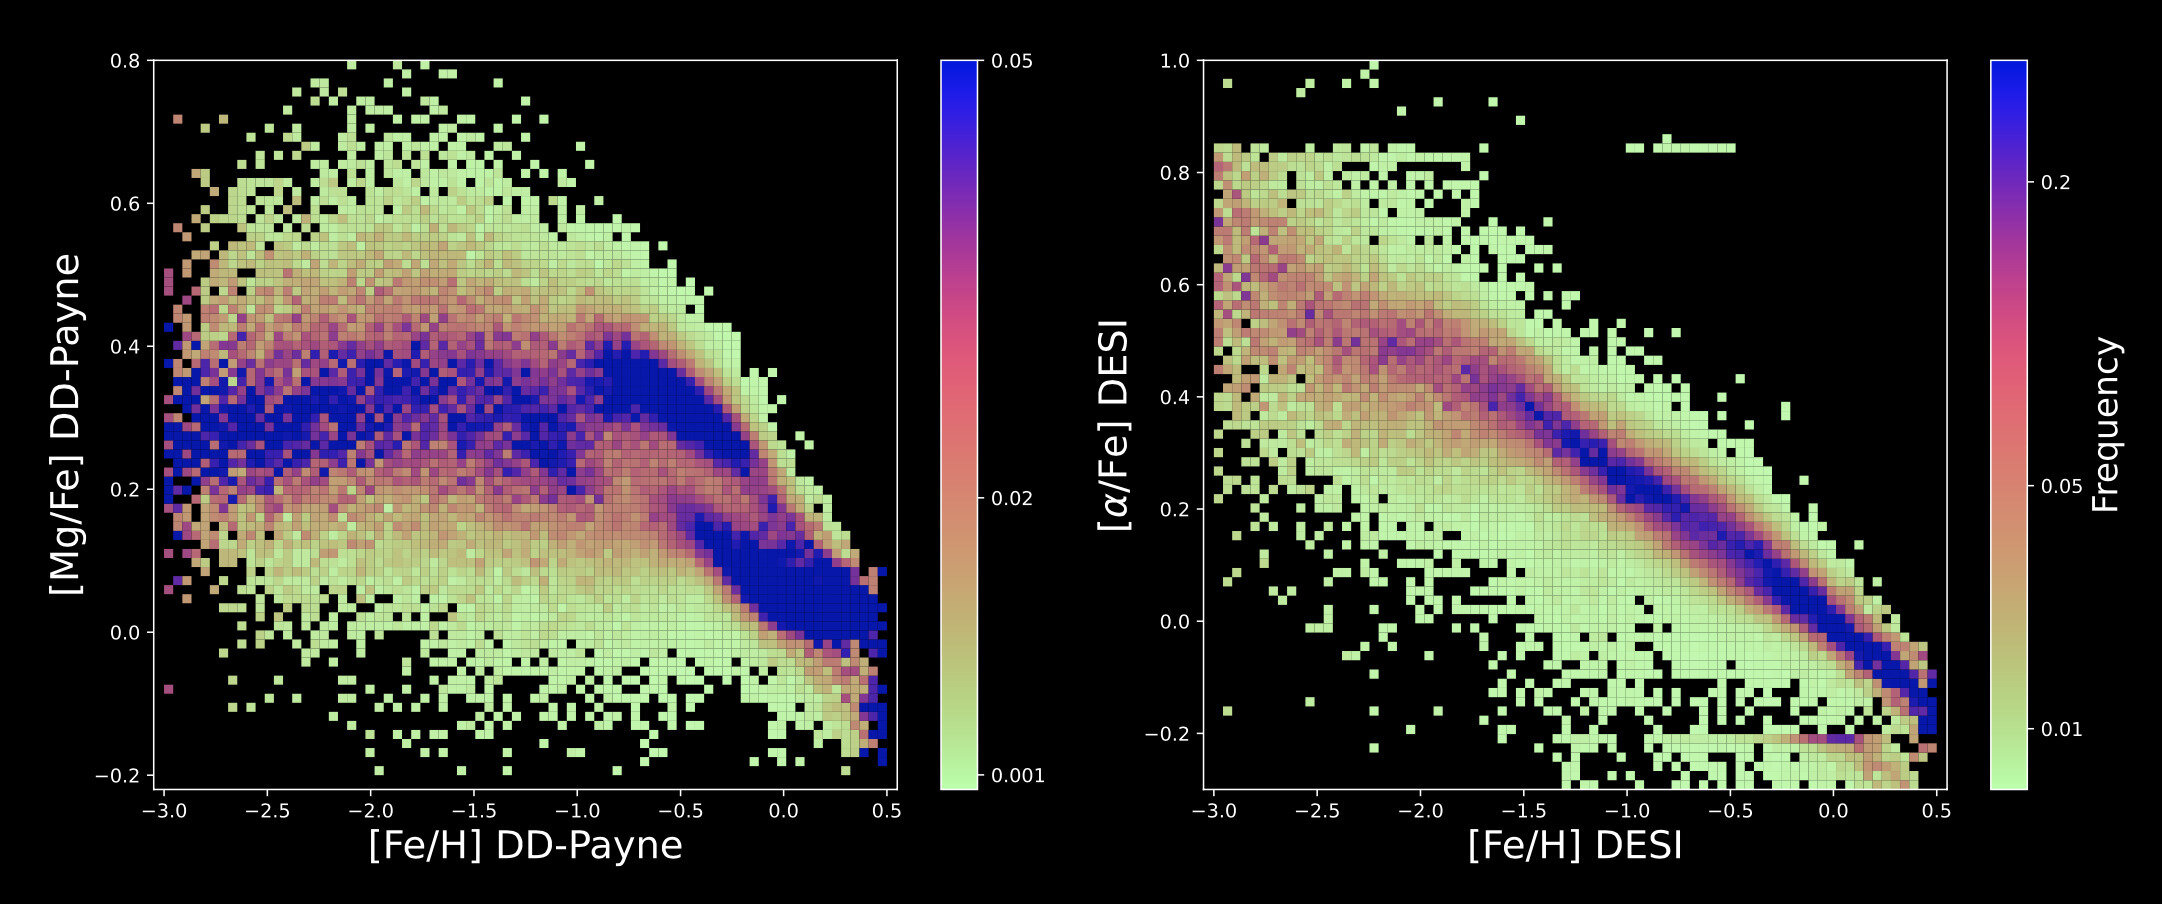
This Study
Classical Pipeline
Zhang, Xiang, YST+ 24
[Fe/H]
-3
-2
-1
0
-3
-2
-1
0
-3
-2
-1
0
-0.2
0.0
0.2
0.4
0.6
0.8
[Mg/Fe]
[Mg/Fe]
Thick Disk
Thin Disk
Gaia-Sausage-Enceladus
Fail to extract detailed structures
-0.2
0.0
0.2
0.4
0.6
0.8
[Mg/Fe]
Physics-Inspired Neural Networks
The fundamentals of Galactic dynamics
Distribution Function of 6D phase space
Gravitational Potential
= 0
(1) Liouville's Theorem
= 0
(2) Stationary
i.e., the system is collisionless
Deep-Potential: Encoding physics into neural networks
"Penalty" function: minimize
Green & YST+ 20 NeurIPS, 23
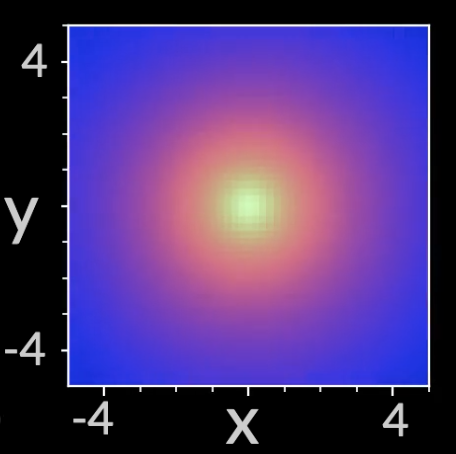
Inferring potential from the distribution function of phase-space tracers
= 0
(1) Liouville's Theorem
= 0
(2) Stationary
i.e., the system is collisionless
Gravitational potential
r
(represented by a neural network)
0.0
-0.5
-1.0
0.1
10
x
y
-4
4
-4
4
True solution
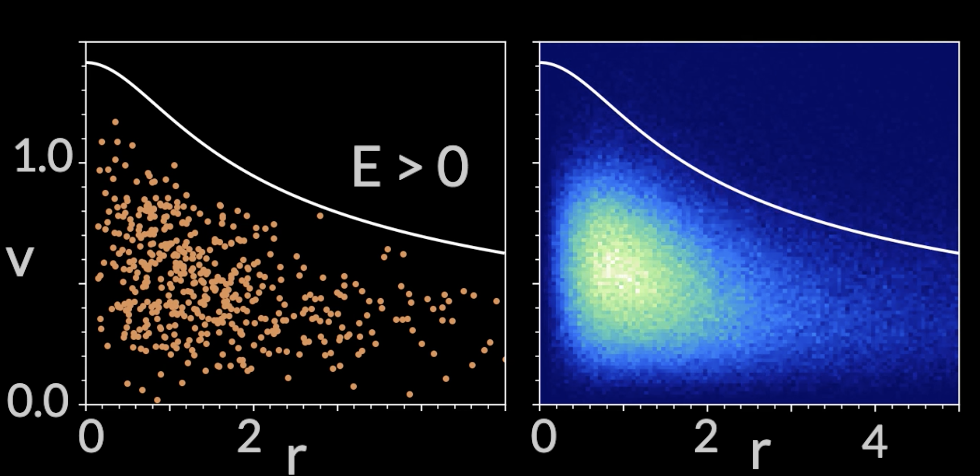
Going beyond ansatz for distribution functions and potential
1.0
1.5
0.5
0.0
v
0
2
4
r
0
2
4
r
Green & YST+ 20 NeurIPS W, 23
4
Input : Phase-space tracers
Output: Gravitational potential
while satisfying the Liouville theorem and being stationary
Green & YST+ 20 NeurIPS W, 23
Going beyond ansatz for distribution functions and potential
Mapping non-axisymmetric density of the Milky Way's halo
N-body Simulations
Deep Potential Recovery
x [kpc]
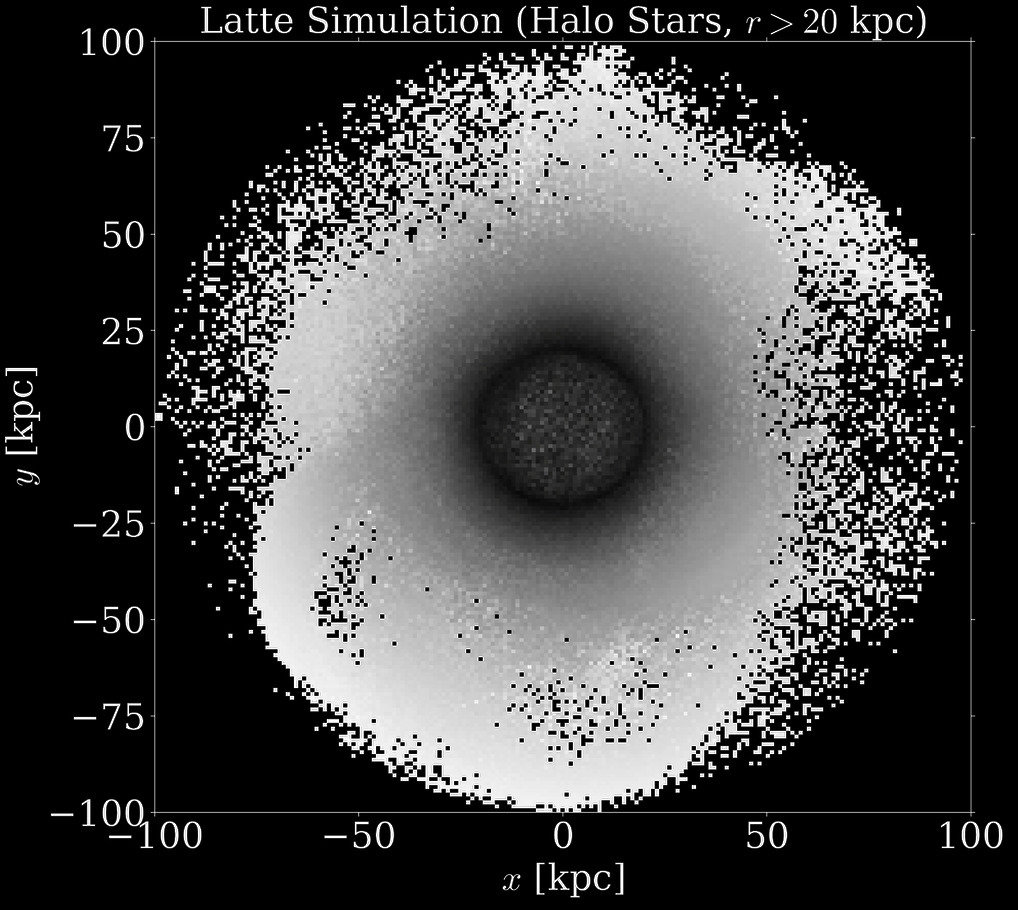
y [kpc]
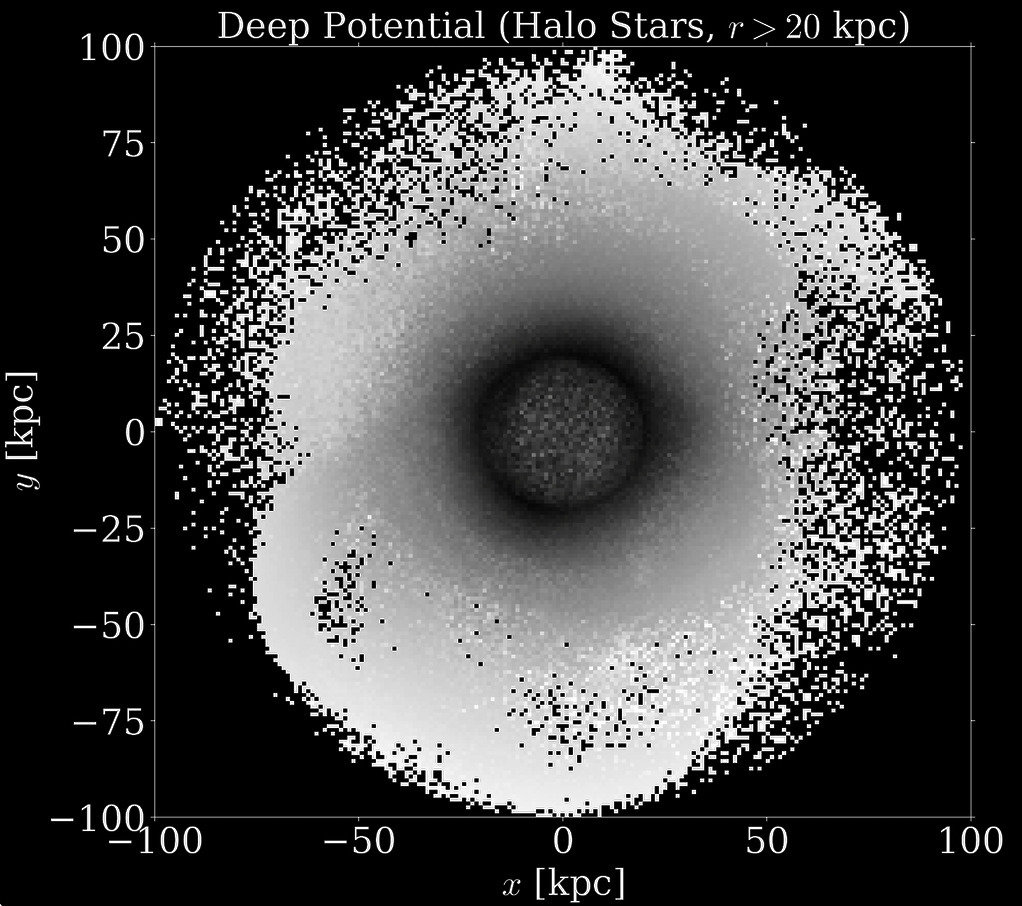
x [kpc]
Observation
Physics
Summary Statistics
Theory
Simulation
= Information Loss
Overcoming the curse of dimensionality
- (1 ) Symmetries
- (2) Physics-Inspired NN
Generative Models
OpenAI's Sora
More statistically robust and "principled" deep learning approaches
e.g., YST & Weinberg 21, Ciuca & YST 22,
Tang & YST 22
Normalizing Flows
Diffusion Models
Modern deep learning are rooted in statistical principles
Are we willing to make the best inferences at the expense of "interpretability"?
"interpretable knowledge"
Accurate detection of cancer
"interpretable knowledge"
Finding a nearby alien race before they kill us off
"interpretable knowledge"
Predicting galaxy evolution
"interpretable knowledge"
Finding new physics ?
Simulations
Big Data
Deep Learning
Big Data
Simulations
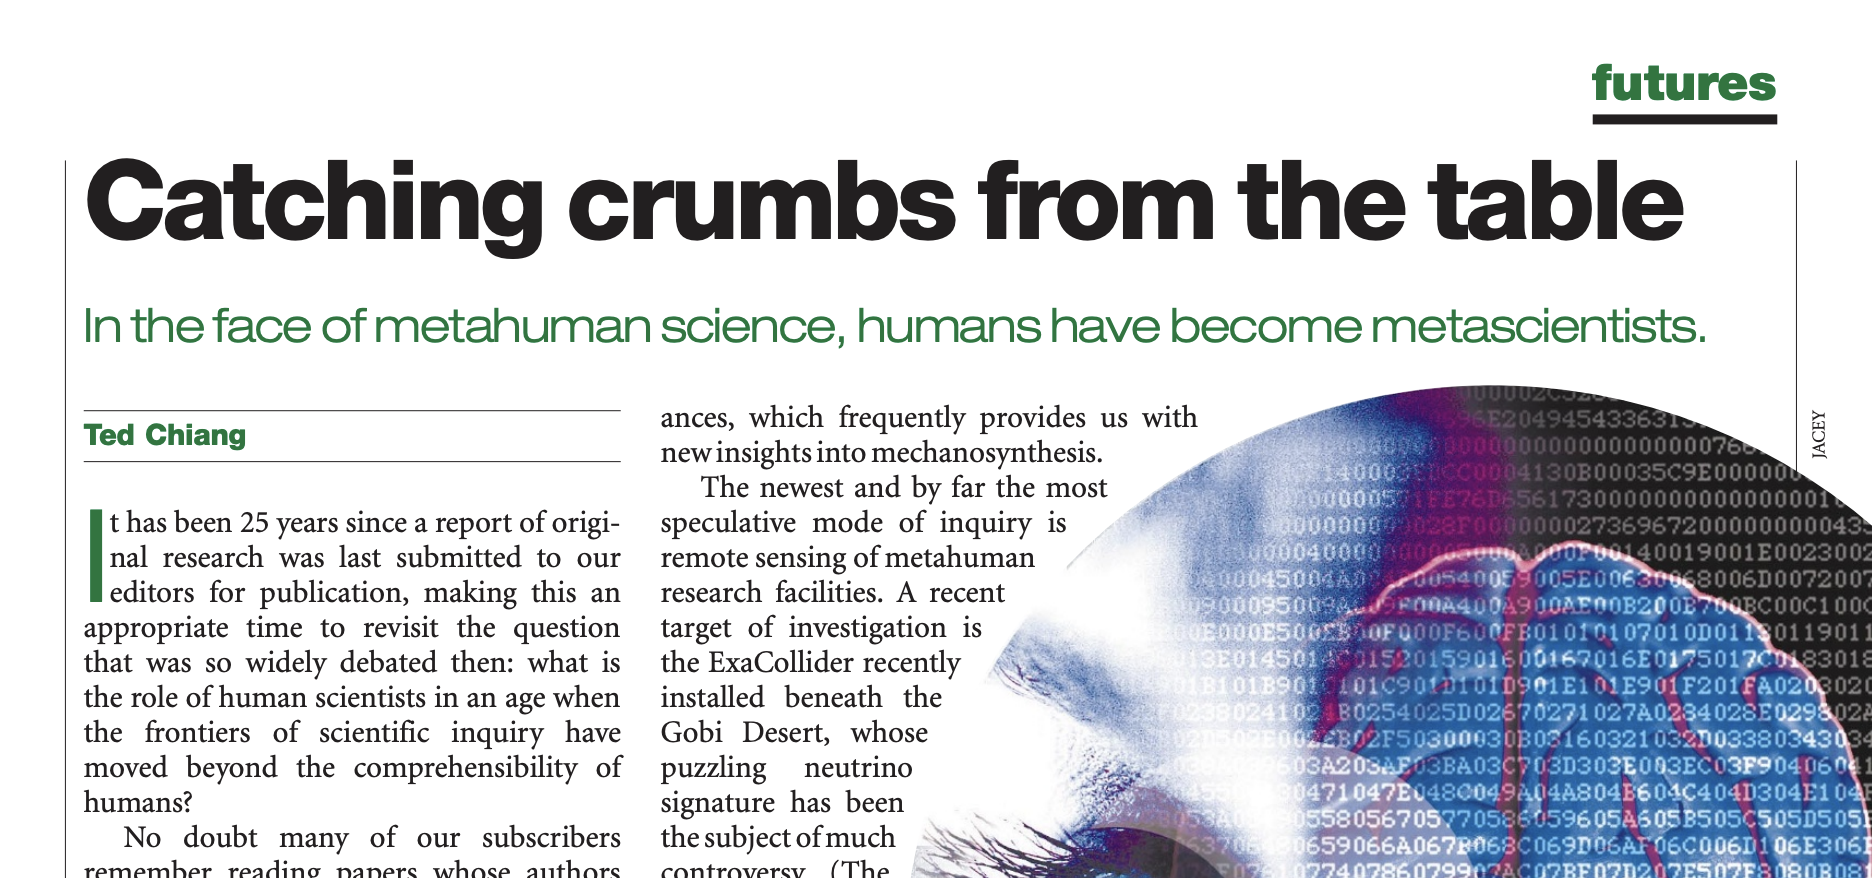
Ted Chiang, Nature, 2000
How to best harness information from simulations ?
Credit : Illustris / TNG
Solution : GNN that respects group action symmetry
A technical slide that probably no one cares .....
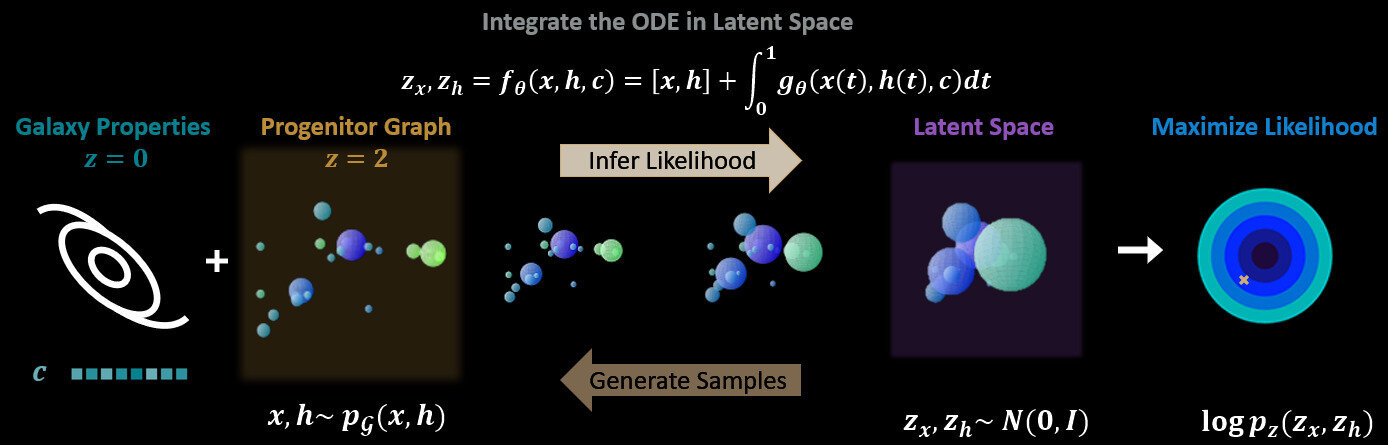
Neural ODE as Normalizing Flow
A technical slide that probably no one cares .....
Graph Neural Network as the integrand
- Can vary in dimension
A technical slide that probably no one cares .....
The message passing function satisfies E(n) equivariances

Graph Neural Networks
Normalizing Flow
Physics INN
Equivariances
SBI
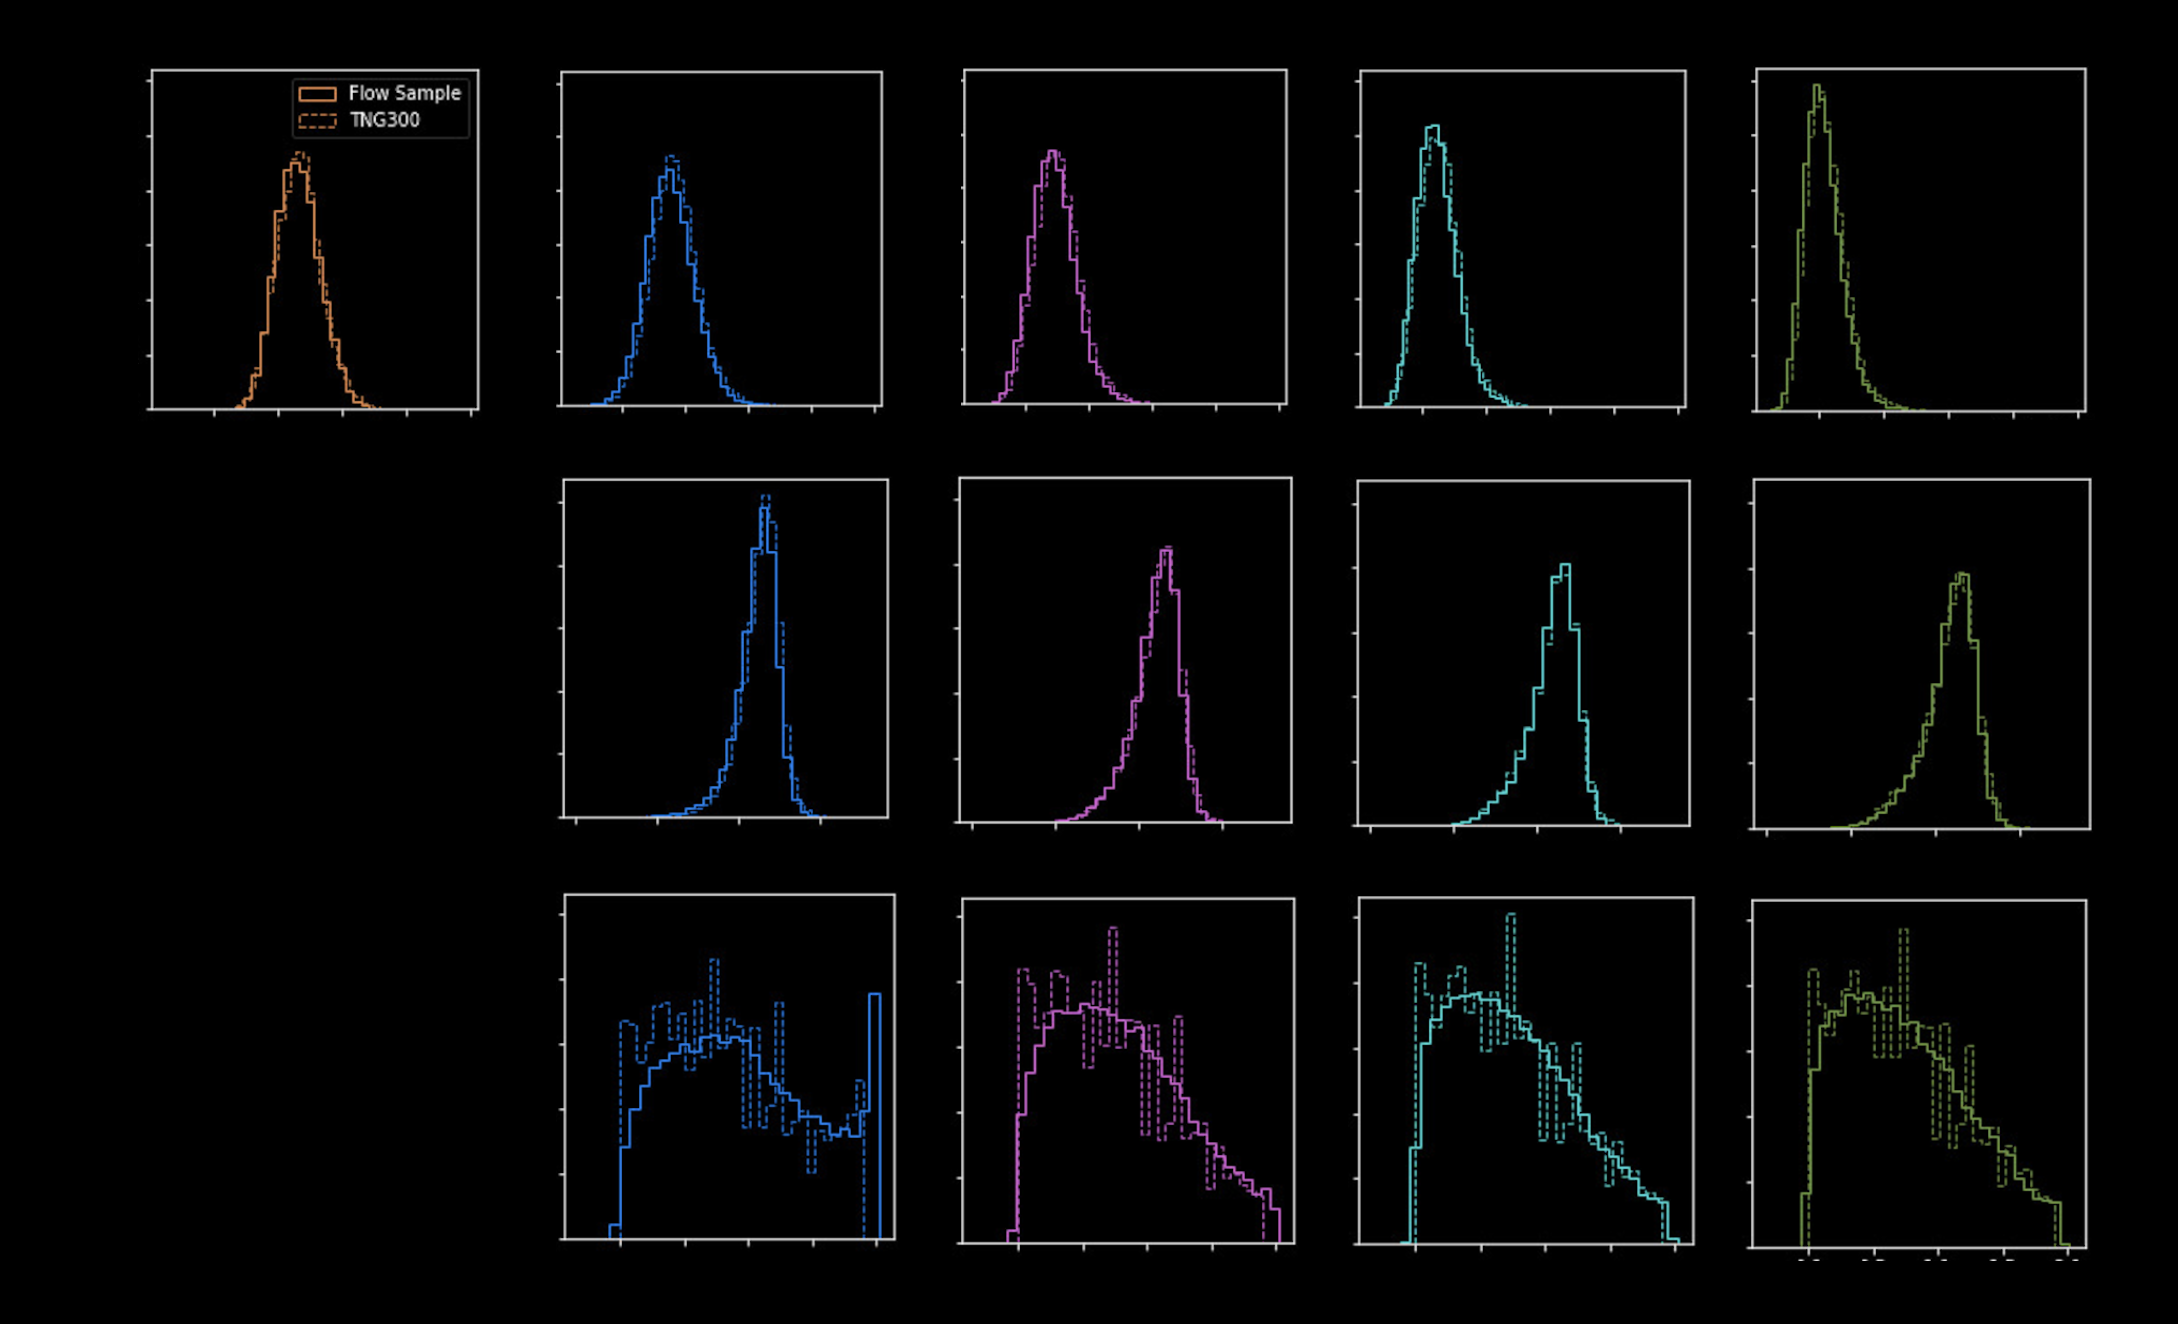
Have we learned the marginal distribution accurately ?
Main Progenitor
1st Merger
2nd Merger
3rd Merger
4th Merger
Stellar mass
Distance from the main progenitor
Merging redshift
Graph generated
TNG 300 simulations
Not possible by looking only at the most similar galaxies in the simulation
Correlations
smeared out
Distilling knowledge from simulations
Distilling knowledge from simulations
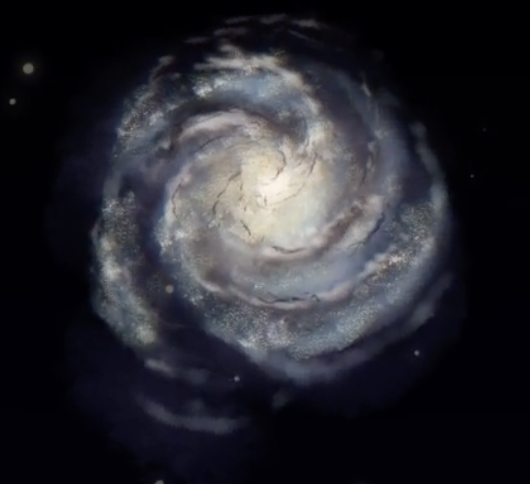
The Milky Way
All the progenitors that can make the Milky Way
M0
M1
M4
M2
M3
z1
z2
z3
z4
M0
Progenitor Mass
Merging
Redshift
Pairwise Separation
Progenitor
Mass
Merging
Redshift
M1
d02
M2
M3
M4
z1
z2
z3
z4
Limited by the
sampling noise
d01
d03
d04
d12
d13
d14
d23
d24
d34

Correlation
-0.5
-0.1
0
0.1
0.5
200 "closest" samples from TNG300
5000 "closest" samples from TNG300
M0
M1
M4
M2
M3
z1
z2
z3
z4
M0
Progenitor Mass
Merging
Redshift
Progenitor
Mass
Merging
Redshift
M1
d02
M2
M3
M4
z1
z2
z3
z4
Too distinct from
the reference point
d01
d03
d04
d12
d13
d14
d23
d24
d34
Correlation
-0.5
-0.1
0
0.1
0.5
Pairwise Separation
From graph generative models
M0
M1
M4
M2
M3
z1
z2
z3
z4
M0
Progenitor Mass
Merging
Redshift
Progenitor
Mass
Merging
Redshift
M1
d02
M2
M3
M4
z1
z2
z3
z4
d01
d03
d04
d12
d13
d14
d23
d24
d34
Correlation
-0.5
-0.1
0
0.1
0.5
A massive main progenitor requires a latter merger to compensate
Pairwise Separation
If the first massive merger happens earlier, the other mergers have to be more massive to compensate
How to identify one-in-a-billion outliers?
Finding interesting outliers which physics are not known

Finding interesting outliers which physics are not known
Phew.... we still needs human to intepret
Source: AI Index Report 2024
2013
2015
2017
2017
2019
2021
2023
0%
20%
40%
60%
80%
100%
Year
human baseline
Image classification
Basic-level reading comprehension
Multitask language understanding
Mathematical reasoning
Performance vs. human
Observed data
Synthetic models
Overcoming model imperfections using domain adaptation
"Observed data"
"Synthetic models"
Overcoming model imperfections using domain adaptation
Overcoming model imperfections using domain adaptation

Overcoming model imperfections using domain adaptation
Closing the synthetic-observation gap with domain adaptation
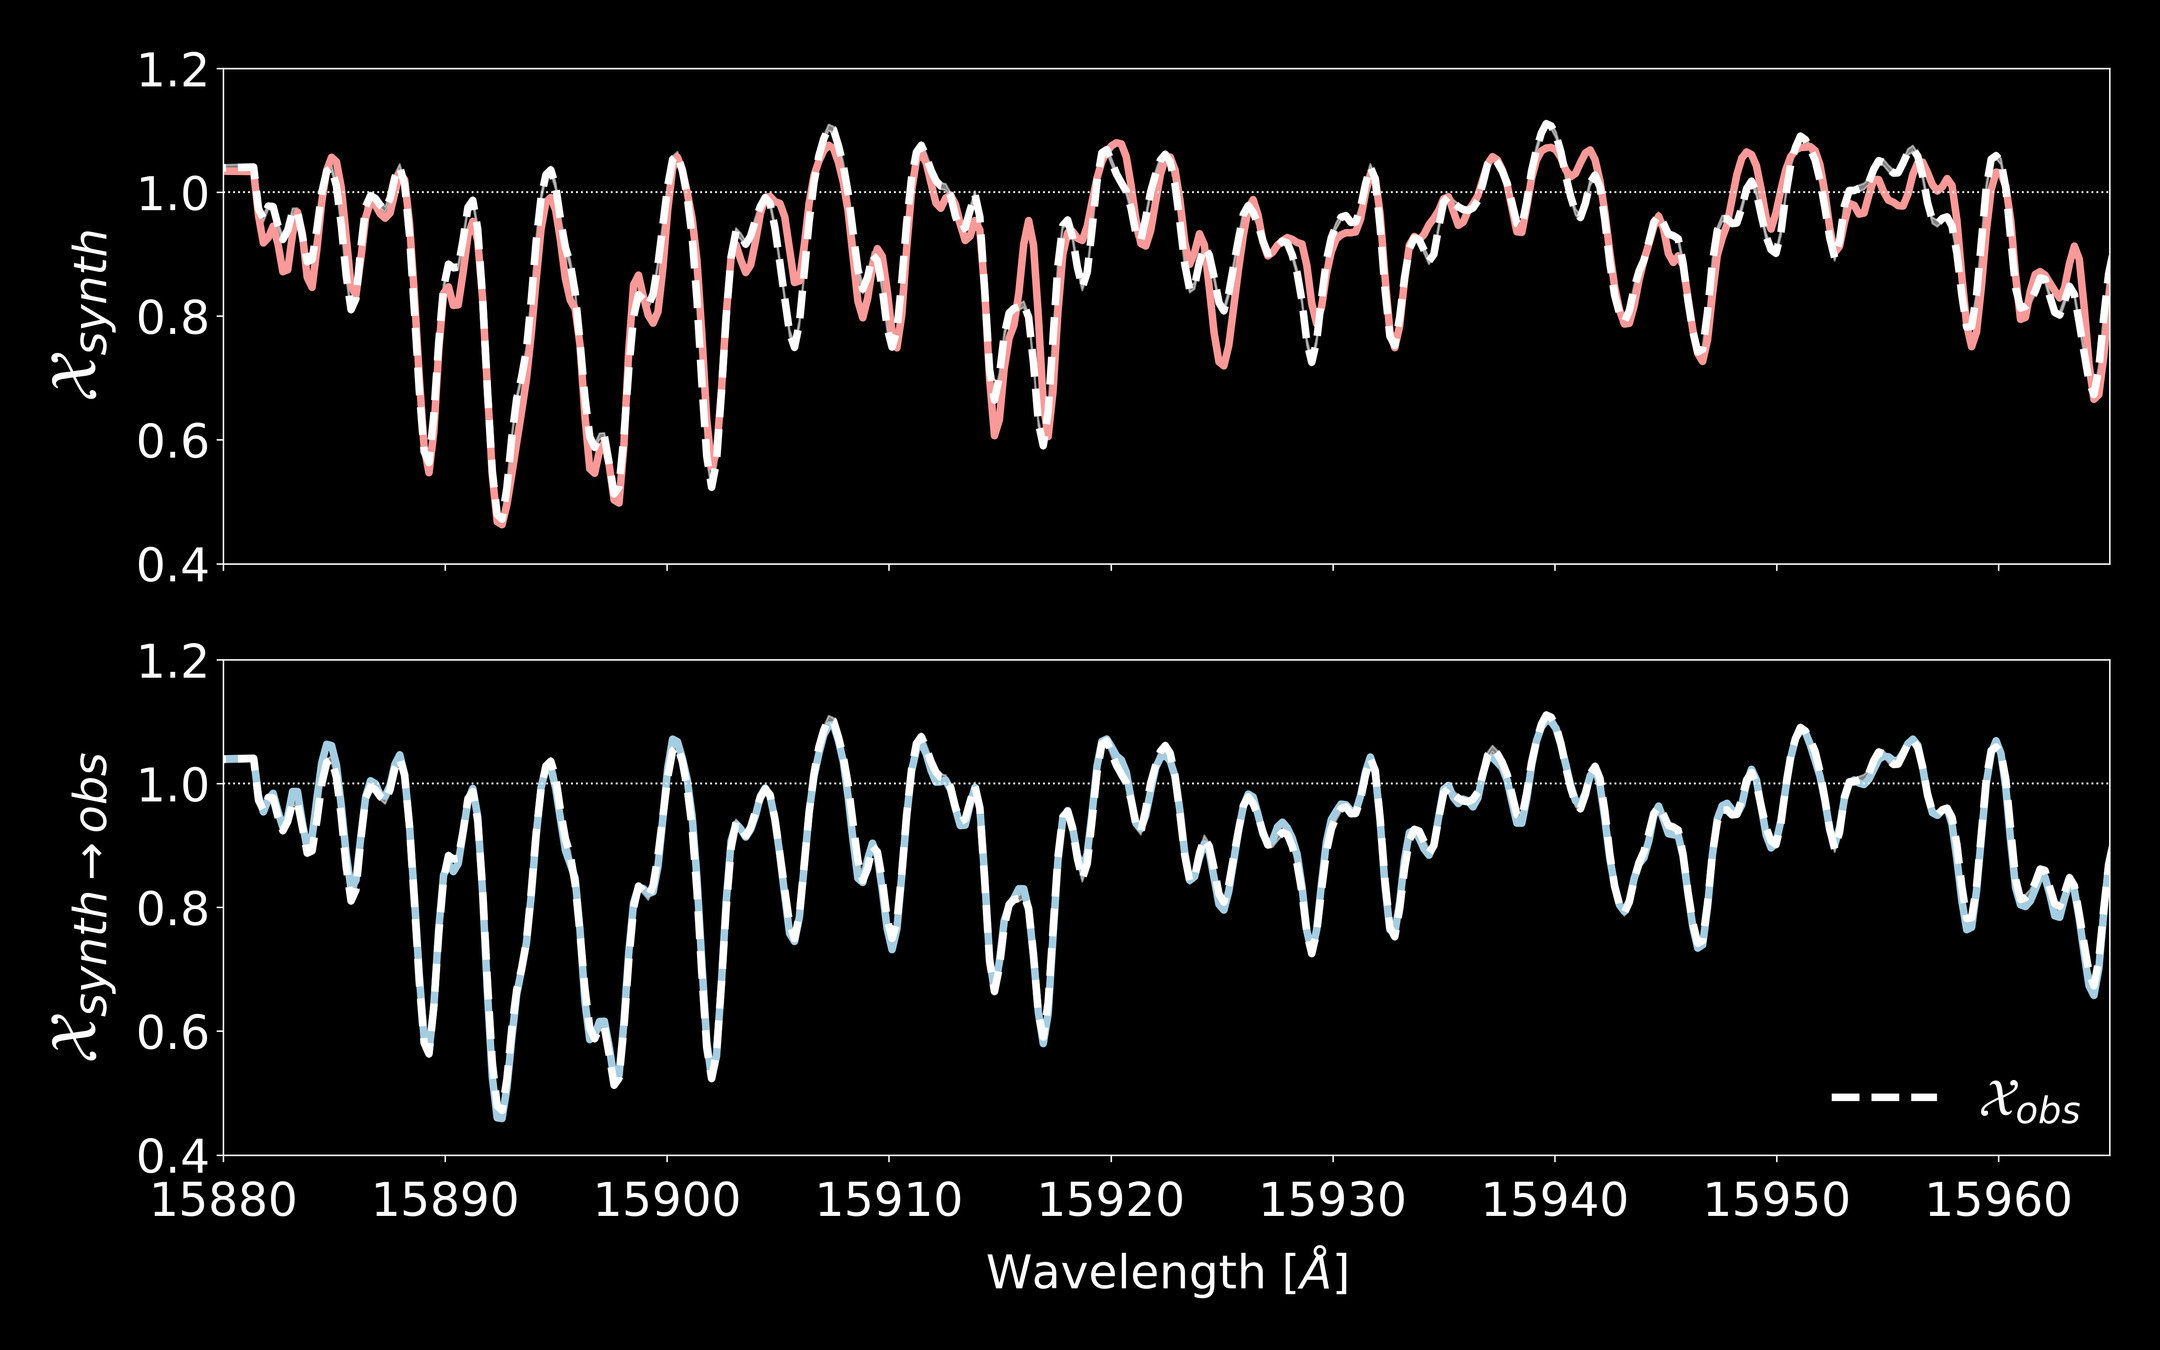
0.5
1.0
0.5
1.0
15900
15950
APOGEE
Kurucz model
Normalized Spectrum
Domain adaptation
Wavelength [A]
, YST+ 2020, ICML
O'Briain
APOGEE
M-dwarfs are hard!